Connector logs
A lot of times while building apps, you would need to check all the API calls and DB calls and understand if there are errors and other things like the request that was sent, the response, response times, response status etc. DronaHQ provides the whole connector logs in the preview section. You will be able to check the following there:
- List of all connector calls
- Timeline view of all connector calls
- Details of each call
- Watchlist of data, controls, keywords and data queries
List of all connector calls
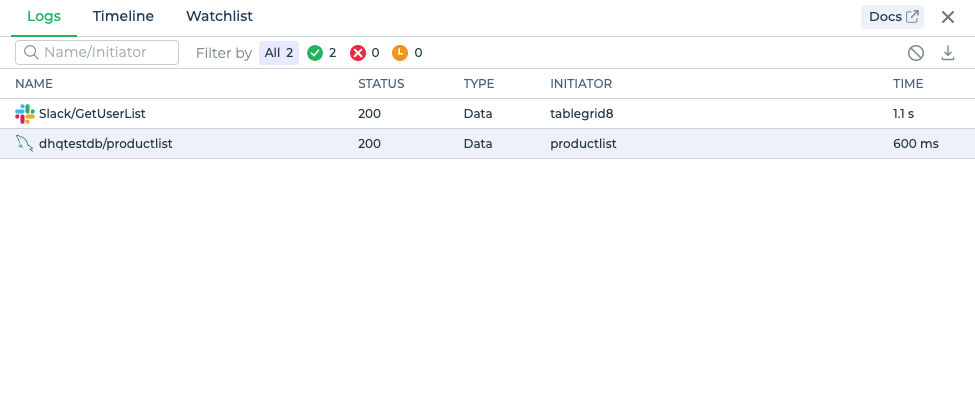
The tab shows a live view of all connector calls. This allows you to view the run times and identify failed, successful, and in progress calls. This comes handy when trying to debug apps with parallel or a lot of connector calls and even chaining of controls with connector calls. You can also search, filter, clear and download the logs.
You can see the following details while viewing the list:
| Details | What it means |
|---|---|
| Name | This is the actual connector call in the format Connector/Query |
| Status | This indicates the actual HTTP status. e.g. 200, 403 etc. Any other status other than 2XX will be indicated in red. |
| Type | This defines where did the call happen from, Data or Action. There are possibilities that the same call is happening at 2 place, this lets you identify the type of the call. |
| Initiator | This will show you the unique id of the Control or Data query which this call is initiating from. |
| Time | This shows the time required for the connector call including the time taken for any JS transformation and other post processing that happens on the data. |
The time that you see is time it takes for the API or DB to respond along with any JS transformation or other data manipulations that are happening with the call.
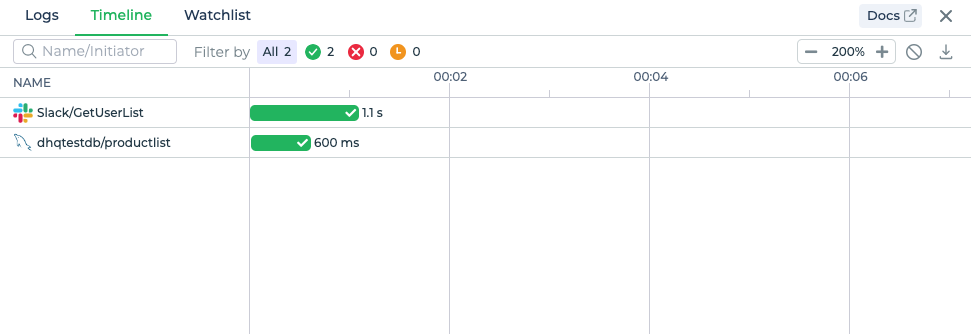
Timeline view
The tab shows a live view of all connector calls in a timeline view. This allows you to view the exact sequence of the connector calls.
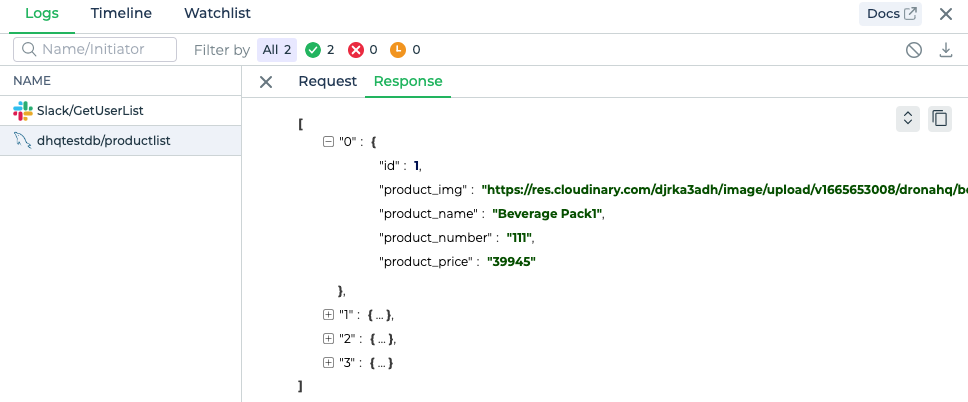
Detail view
You can click on each connector call to drill down and see the details of each connector call. This comes handy when you want to debug and check the exact request and response of the call.
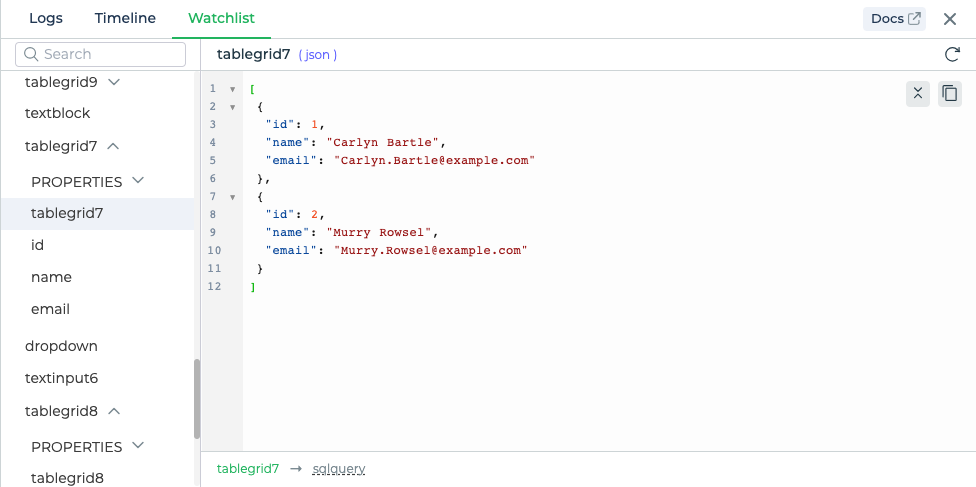
Watchlist
A lot of times while debugging the connector calls, you also would need to check if all the controls or any keywords are reflecting the right appropriate values, this view will not only give you the details of the data in each control or keyword or query but also show you the forward and backward referencing that it has. You can click and jump to each reference here.