Monitoring
What is Monitoring in AI Agents?
Monitoring interface gives you full visibility into your AI agents' health, performance, and operational costs. It is divided into two primary sections:
- Analytics Dashboard: A real-time data aggregation layer parsing operational usage metrics, tool consumption rates, and concurrent agent status.
- TracesView: An immutable distributed transaction log capturing multi-hop agent execution trees, payload mutations, cross-system latency data, and exact multi-currency token pricing models.
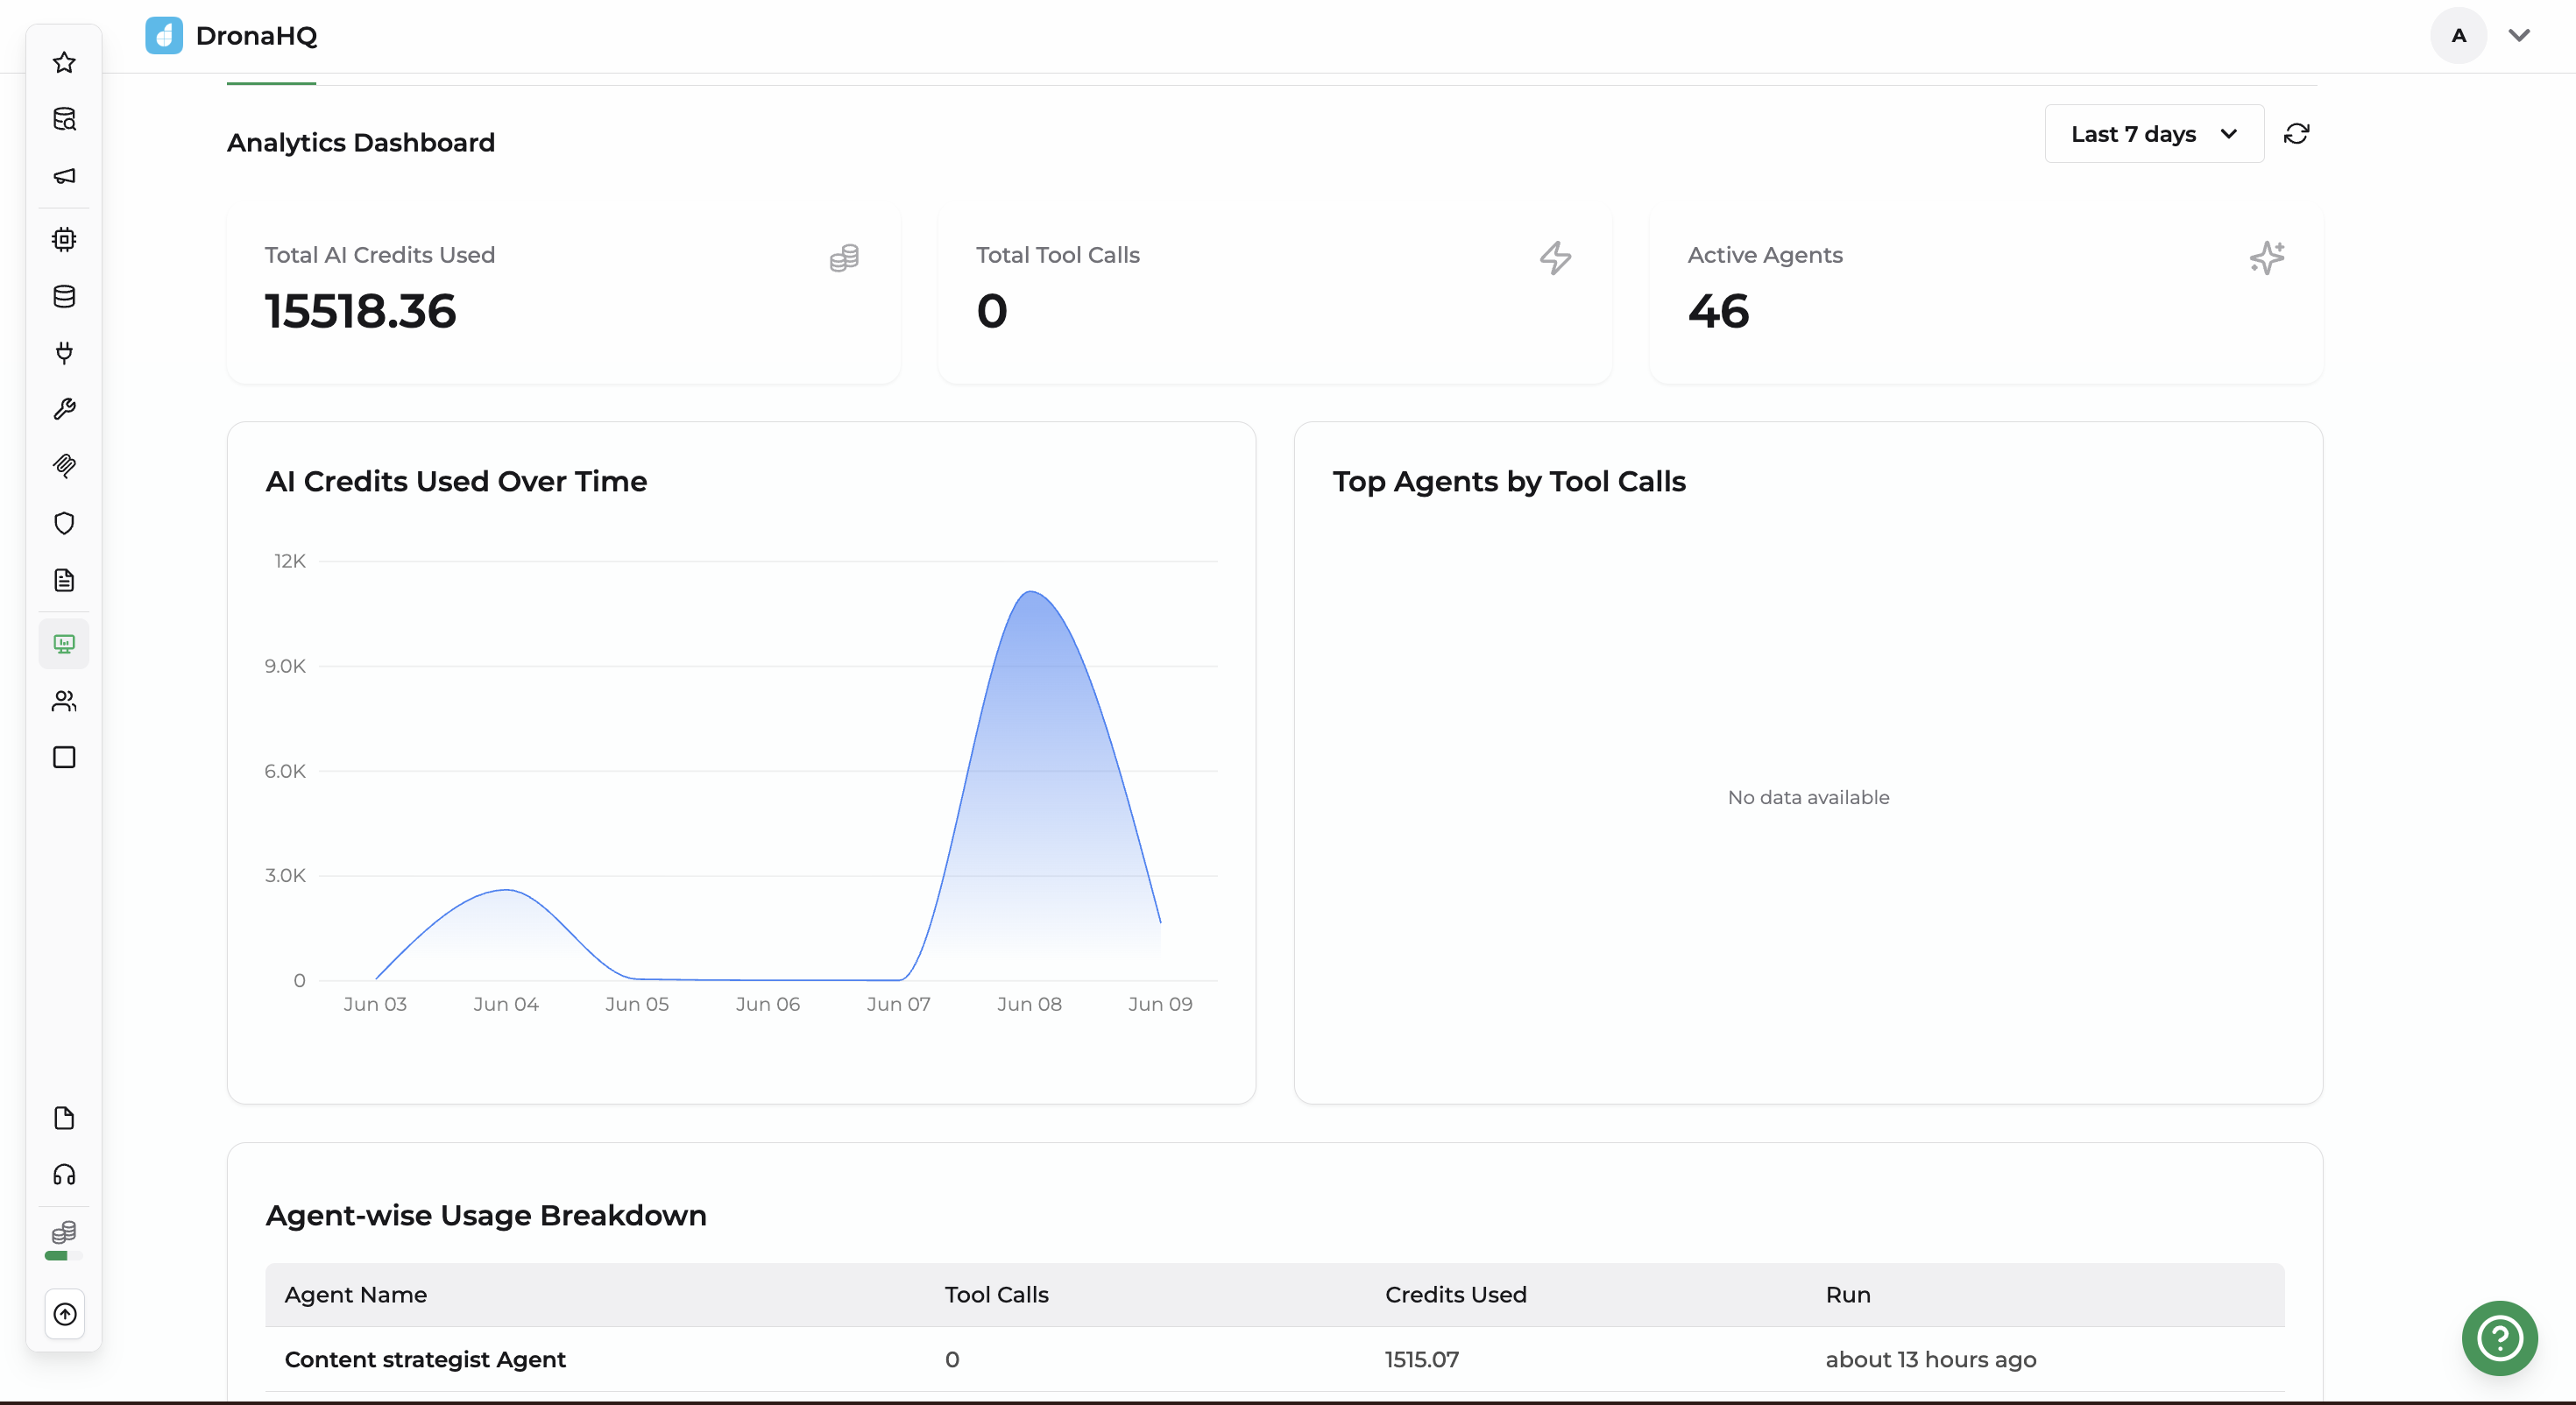
1. Analytics Dashboard
This section acts as your immediate health check. Use it to quickly track how much your ecosystem is costing and how heavily your platform is being utilized.
| Field | What It Measures | How to Read / Interpret It |
|---|---|---|
| Total AI Credits Used | Aggregate financial or token-based cost. | Track this number to monitor your overall workspace consumption budget. |
| Total Tool Calls | Total number of external actions executed. | Shows how often agents are interacting with third-party APIs, databases, or scripts. A value of 0 means agents are processing text natively without triggering external tools. |
| Active Agents | Count of functioning agents. | The total number of unique AI agents that have successfully executed at least one task within your selected timeframe. |
| AI Credits Used Over Time | Daily cost fluctuations on a timeline. | Spikes in this graph indicate high-volume processing days or unexpected agent loops that consumed excess compute. |
| Top Agents by Tool Calls | Distribution of tool usage per agent. | Identifies which specific agents are triggering the most external integrations. Displays "No data available" if there has been zero activity. |
2. Traces
While the dashboard shows what happened in aggregate, the Traces section shows exactly how each task happened. Trace data acts as an immutable ledger, but it is only retained for 30 days before being cleared.
When reading the logs from left to right, each column gives you a piece of the execution puzzle:
| Fields | Field Components & Data Captured | How to Read / Interpret It for Troubleshooting |
|---|---|---|
| Messages | System Messages: Automation origins (e.g., triggered by a cron expression, incoming customer emails, sender names, representative emails, LinkedIn URLs, and agent-generated Lead Summaries analyzing target use cases). | This is your primary debugging window. Read this to see the exact text inputs the agent received, how it reasoned through the data, and the final synthesis or message it produced. |
| Trigger | Event that initiated agentic runtime execution. | Identifies how the workflow started (e.g., scheduler, webhook, chat). |
| Agent | The specific name of the configured AI agent. | Tells you exactly which workflow block or agent setup (e.g., enrichment_agent or EmailMessager) to modify if the output needs adjustment. |
| Tool Calls | Count of external interactions during the run. | The exact number of operational steps or integrations the agent utilized to solve the task. A higher number indicates a more complex, multi-step workflow. |
| Latency (s) | Time elapsed in seconds. | Measures the total execution speed. High latency indicates either an external API took a long time to reply or the underlying AI model took longer to generate its response. |
| Run | Human-readable relative timestamp. | Displays when the execution occurred relative to the current moment (e.g., "about 13 hours ago" or "2 days ago"). |
| Credits | Single-run transactional cost. | The exact operational cost generated by this specific execution alone. Use this to pinpoint and optimize your most expensive workflows. |
FAQ 1: How can I monitor AI agent performance and costs in DronaHQ?
The Monitoring dashboard provides real-time visibility into AI agent performance, usage, and operational costs. You can track metrics such as Total AI Credits Used, Total Tool Calls, Active Agents, and AI Credits Used Over Time. These insights help identify high-cost workflows, monitor platform adoption, and optimize agent efficiency.
FAQ 2: What is the difference between the Analytics Dashboard and Traces in AI Agent Monitoring?
The Analytics Dashboard provides an aggregated view of AI agent activity, including usage trends, costs, and tool consumption across your workspace. The Traces section provides execution-level visibility, allowing you to inspect individual agent runs, triggers, tool calls, latency, messages, and credit consumption for troubleshooting and debugging purposes.
FAQ 3: How do I troubleshoot AI agent workflows using Traces?
The Traces view acts as a detailed execution log for every AI agent run. You can inspect the trigger event, input messages, agent selected, external tool calls, execution latency, and credit usage. This helps identify failed workflows, slow API responses, incorrect outputs, integration issues, and opportunities to optimize agent performance.
FAQ 4: Why are my AI agent costs or AI credit usage increasing?
An increase in AI credit consumption is typically caused by higher agent activity, increased tool calls, longer AI model responses, or multi-step workflows. Use the AI Credits Used Over Time chart and Traces view to identify specific agents, executions, or integrations responsible for increased usage and operational costs.
FAQ 5: How long are AI agent execution logs and traces retained?
AI agent trace data is retained for 30 days. During this retention period, you can review execution history, analyze workflow behavior, investigate failures, measure latency, and track credit consumption. After 30 days, trace records are automatically removed from the system.