Automation Run Logs
The Automation Run Logs feature empowers users to comprehensively analyze the entire automation process, providing detailed insights into the chronological sequence, timestamps, and statuses of each task executed within the automation builder.
To access the Automation Run Logs, follow these steps:
- Click the
Logsbutton in the left-side menu bar. - This action will open the
Log Panelat the bottom of the interface.
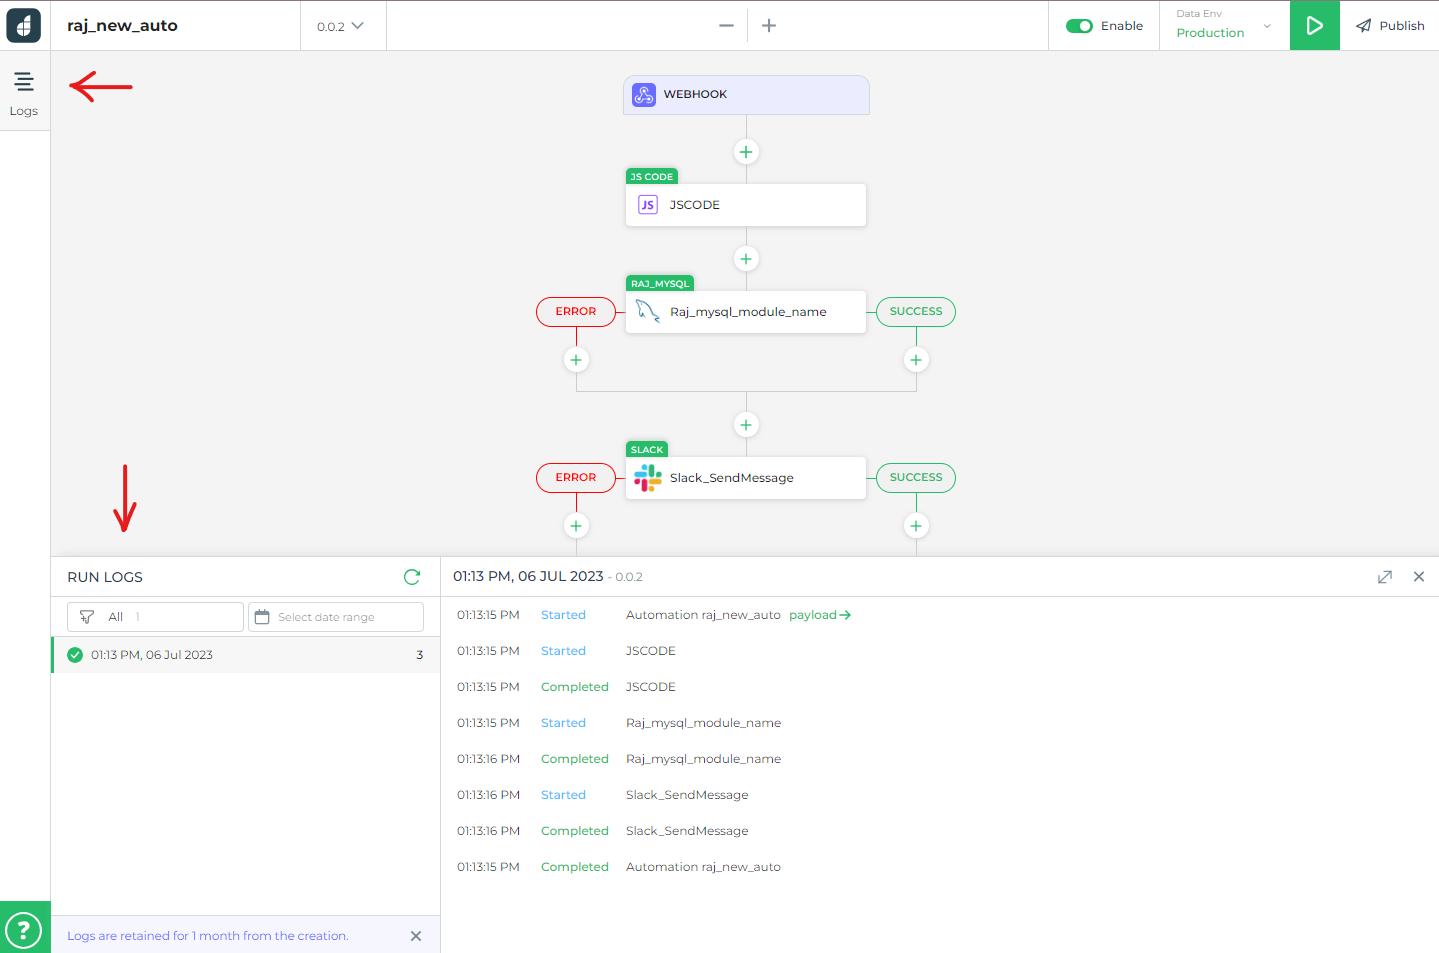
Please note that the availability of logs is limited to a specific time period, typically one month.
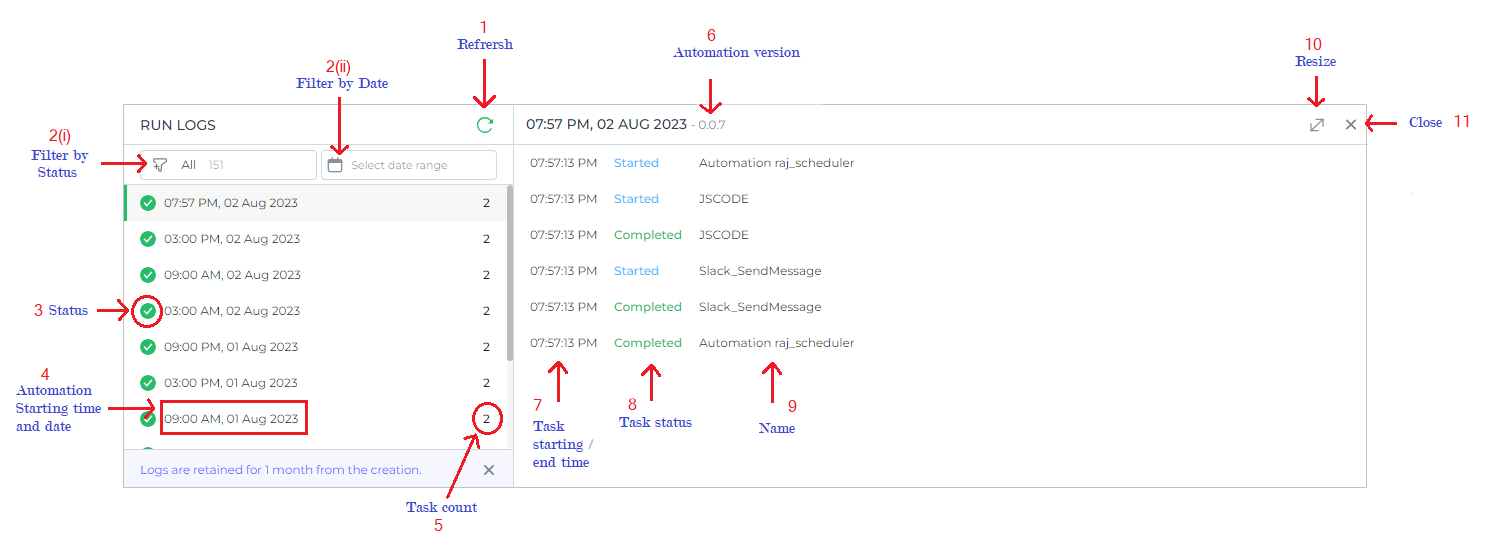
Exploring the Run Logs Panel
Let's delve into the details of the Automation Run Log Panel, examining each component in-depth:
| S.No | Feature | Description |
|---|---|---|
| 1 | Refresh | Refreshes the list of logs. |
| 2 (i) | Filter by Status | Filters logs by status (All, Completed, With error, Failed). |
| 2 (ii) | Filter by Date | Filters logs by selected date range. |
| 3 | Status | Indicates the status of the automation run. |
| 4 | Start Time and Date | Shows the time and date when the automation was triggered. |
| 5 | Task Count | Displays the number of tasks executed in a single automation. |
| 6 | Automation Version | Indicates the automation version (Only shown in live automation; in test logs, it shows 'Test Run'). |
| 7 | Task Start/End Time | Displays task start and end times. |
| 8 | Task Status | Shows the task status (Started, Completed, Failed, Skipped). |
| 9 | Name | Displays the name of the automation or task. |
| 10 | Resize | Resizes the log panel. |
| 11 | Close | Closes the log panel. |
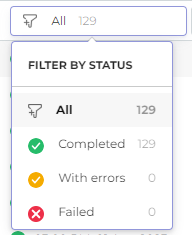
Filter by Status
Enhance your log viewing experience by using the status filters. Each filter option provides valuable insights into the status of your automation runs.
All:View all automation logs, providing a comprehensive overview of all activities.Completed:Focus on successfully completed automation logs, highlighting your successful executions.With Error:Identify automation logs where the overall automation completed, but some tasks within encountered errors.Failed:Pinpoint logs where the entire automation run failed to execute.
Filter by Date Range
Fine-tune your log exploration by leveraging the date range filter. This feature allows you to narrow down your search to specific time periods, helping you locate and analyze logs more effectively.
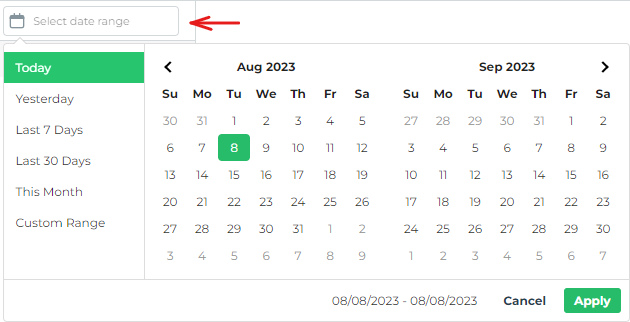
The power of these filters truly shines when used in conjunction. By combining both filters, you can precisely target and analyze automation logs based on their status and the date of execution.
Custom Task Logging
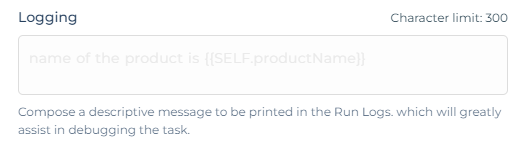
In addition to the default task logs, you have the ability to add your own custom messages to be displayed in the Run Logs. This feature proves to be extremely useful for effectively debugging tasks. You can access this feature for each individual task configuration within the Advanced accordion.
In selfhosted, you can configure the character limit with AUTOMATION_LOGGING_CHARACTER_LIMIT environment variable.
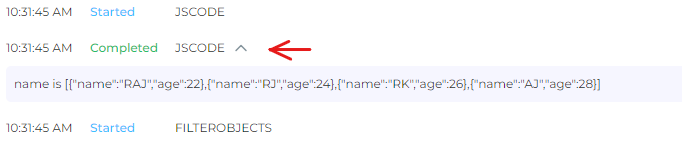
In the Run Log, these custom log messages will be shown alongside the respective tasks they are associated with. To view the custom log message for a specific task, follow these steps:
- Locate the corresponding task entry in the Run Log.
- Click on the
Down/Up Arrowicon located next to the task name.
Webhook Logs
When dealing with webhooks, you gain access to a set of additional logs that can provide valuable insights into the webhook's operation. These logs include:
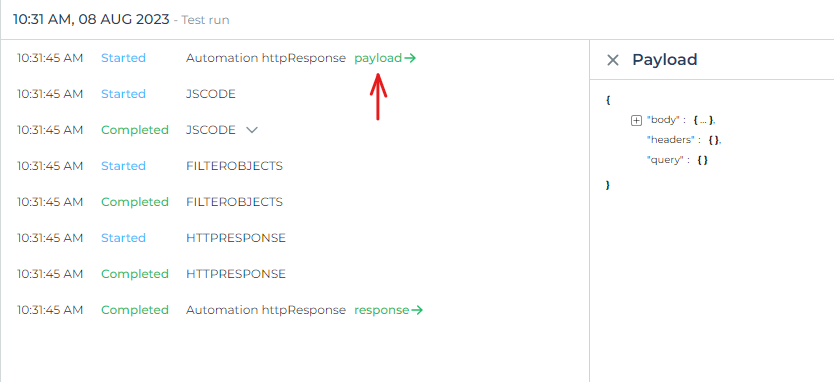
Payload
Displays the payload data sent as part of the webhook request.
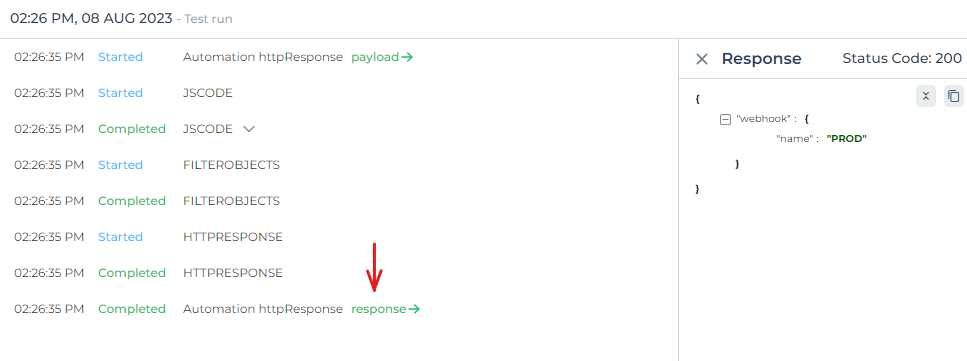
Response
This log captures the response generated when an Http Response task is utilized within the webhook process. It provides details about the response received from the endpoint.
By harnessing the power of DronaHQ's Automation Run Logs, you're equipped with an invaluable tool to unravel the intricacies of your automation processes. The comprehensive insights provided by these logs empower you to track task statuses, timestamps, and custom task logs with precision. The ability to filter logs by status and date range enhances your analytical capabilities, making troubleshooting and performance optimization a streamlined endeavor.