Creating Your First Dashboard on DronaHQ
Creating dashboards in DronaHQ allows you to visualize and manage data effectively. This guide is designed to help data analysts, business analysts, and data scientists make the most of DronaHQ's user-friendly interface for comprehensive data exploration and visualization. With this step-by-step tutorial, you'll learn to create powerful dashboards in minutes, all without needing to write any code.
This tutorial is intended for users who want to create charts and dashboards in DronaHQ. We’ll cover from connecting database for creating dataset, to building chart, and add visualizations to a dashboard. Start by navigating to DronaHQ Dashboards from your DronaHQ account.
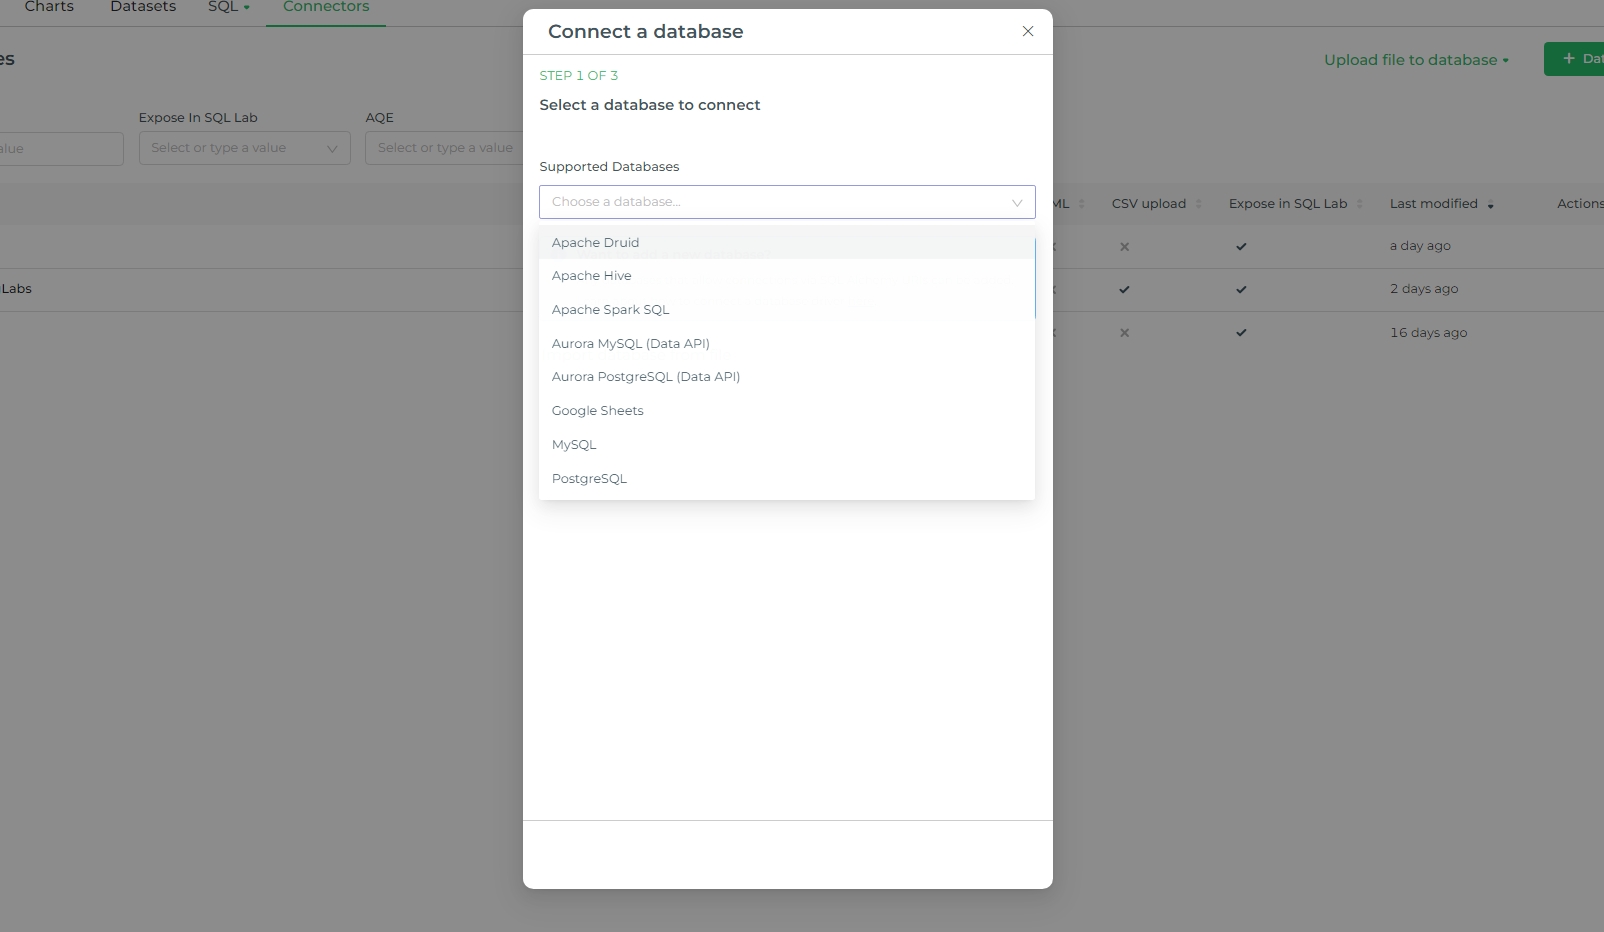
1. Connecting to Database
First, we need to add a connector. It has a + Database button, which allows you to add a connector for your database where the data is stored and will be further used to create datasets and charts, eventually leading to the creation of a dashboard.
This includes minimal steps:
- Select the database, provide configuration details, and connect it. You can configure a number of advanced options in this window.
- There are other options to try, such as CSV upload, columnar file upload, and Excel file upload.
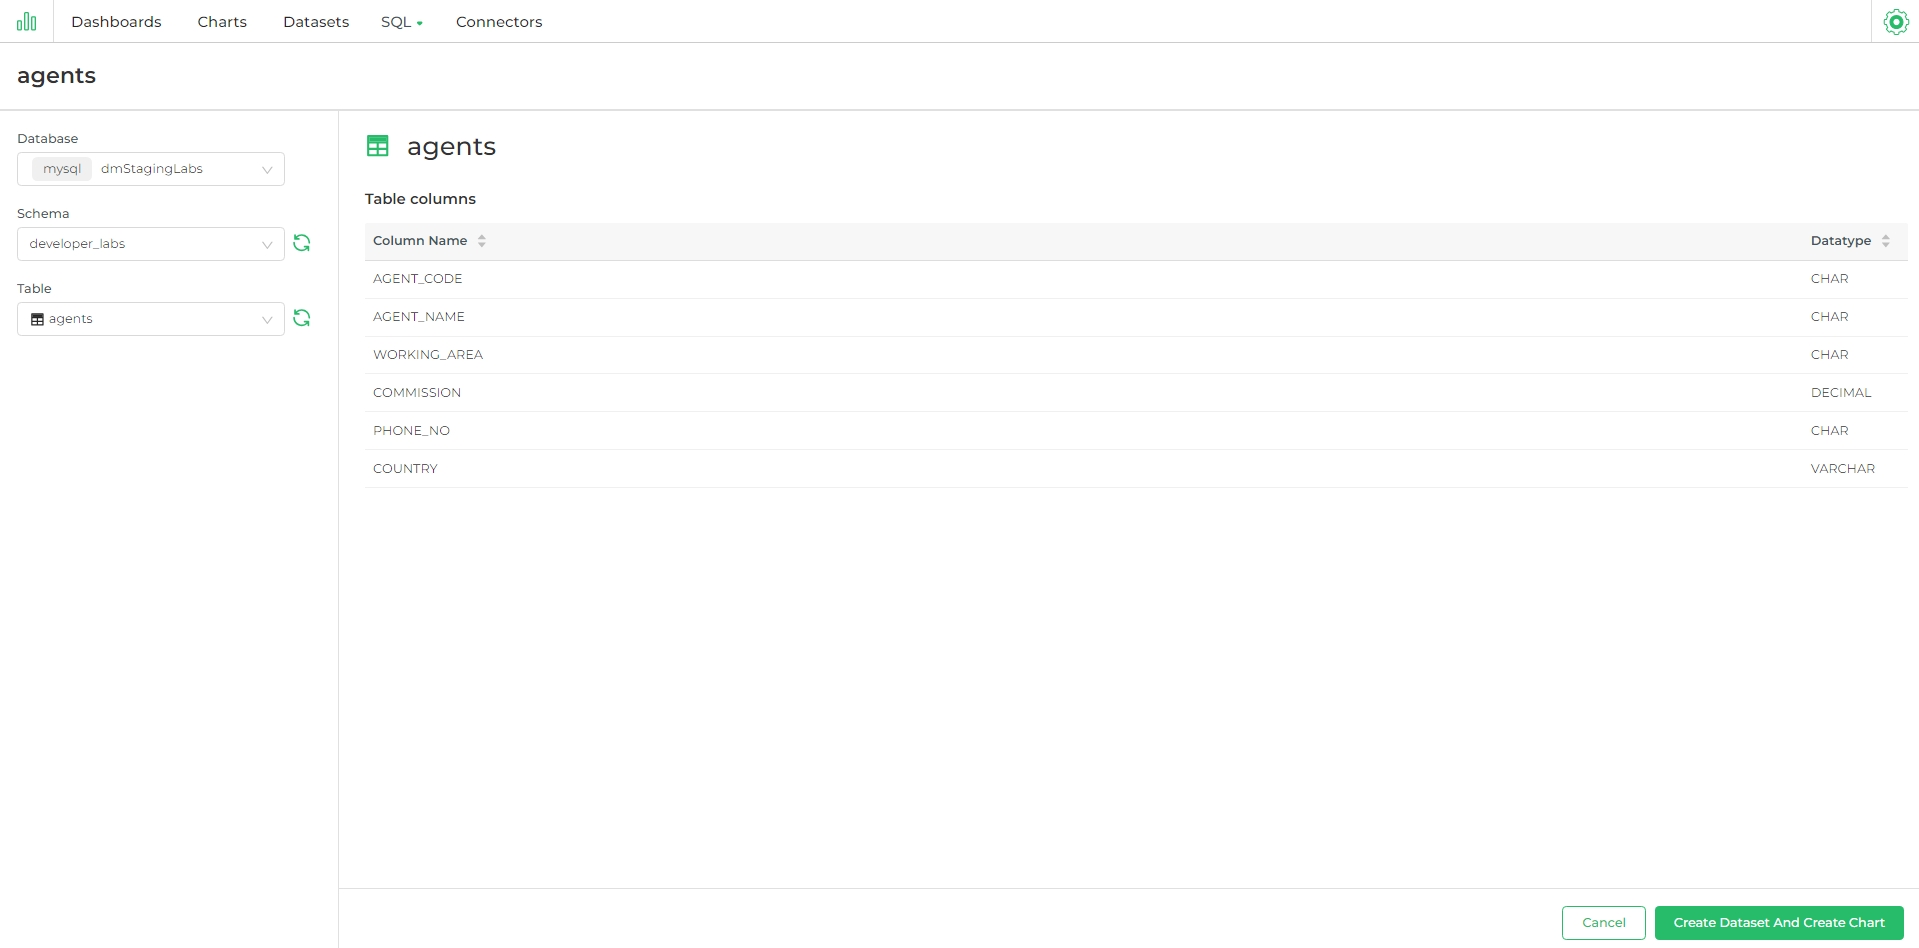
2. Registering Dataset
Now that you’ve configured a data source, you can select specific tables that you want to expose in DronaHQ Dashboard for querying.
Navigate to Datasets and select the + Dataset button in the top right corner.
- Datasets can be created from database tables or SQL queries. Once the schema is loaded, select the appropriate table.
- After the table columns are fetched, the Create Dataset and Create Chart button will be enabled.
- Click this button to create your dataset, and a new screen with chart creation options will appear.
3. Creating a New Chart
After creating the dataset, you will be redirected to the Chart Creation section, where your newly created dataset will already be selected. Alternatively, you can manually click + Chart, then choose the dataset you created.
DronaHQ Dashboard offers a wide variety of charts and tags for users to choose from. Select the chart type you want to use for your dataset, then click Create New Chart.
Data Visualization Configuration
In the next step, you will configure the data available to you. Select different columns from the metrics, apply filters, and set the order. Customize the result data format, color, attribute names, and more. Once you have configured the settings, click Create Chart.
A preview of the chart with the provided data configuration will be generated. You can make further customizations; after each edit, click Update Chart.
You now have a robust workflow for exploring data and refining charts.
- The Dataset view on the left displays a list of columns and metrics specific to the selected dataset.
- The Data preview below the chart area provides useful data context.
- Using the Data and Customize tabs, you can change the visualization type, select the time column, choose the metric to group by, and adjust the chart's aesthetics.
Make sure to click the Run button to see visual feedback as you customize your chart.
In the screenshot below, we create a country Map Chart to visualize birth in France by region, simply by selecting options from the drop-down menus.
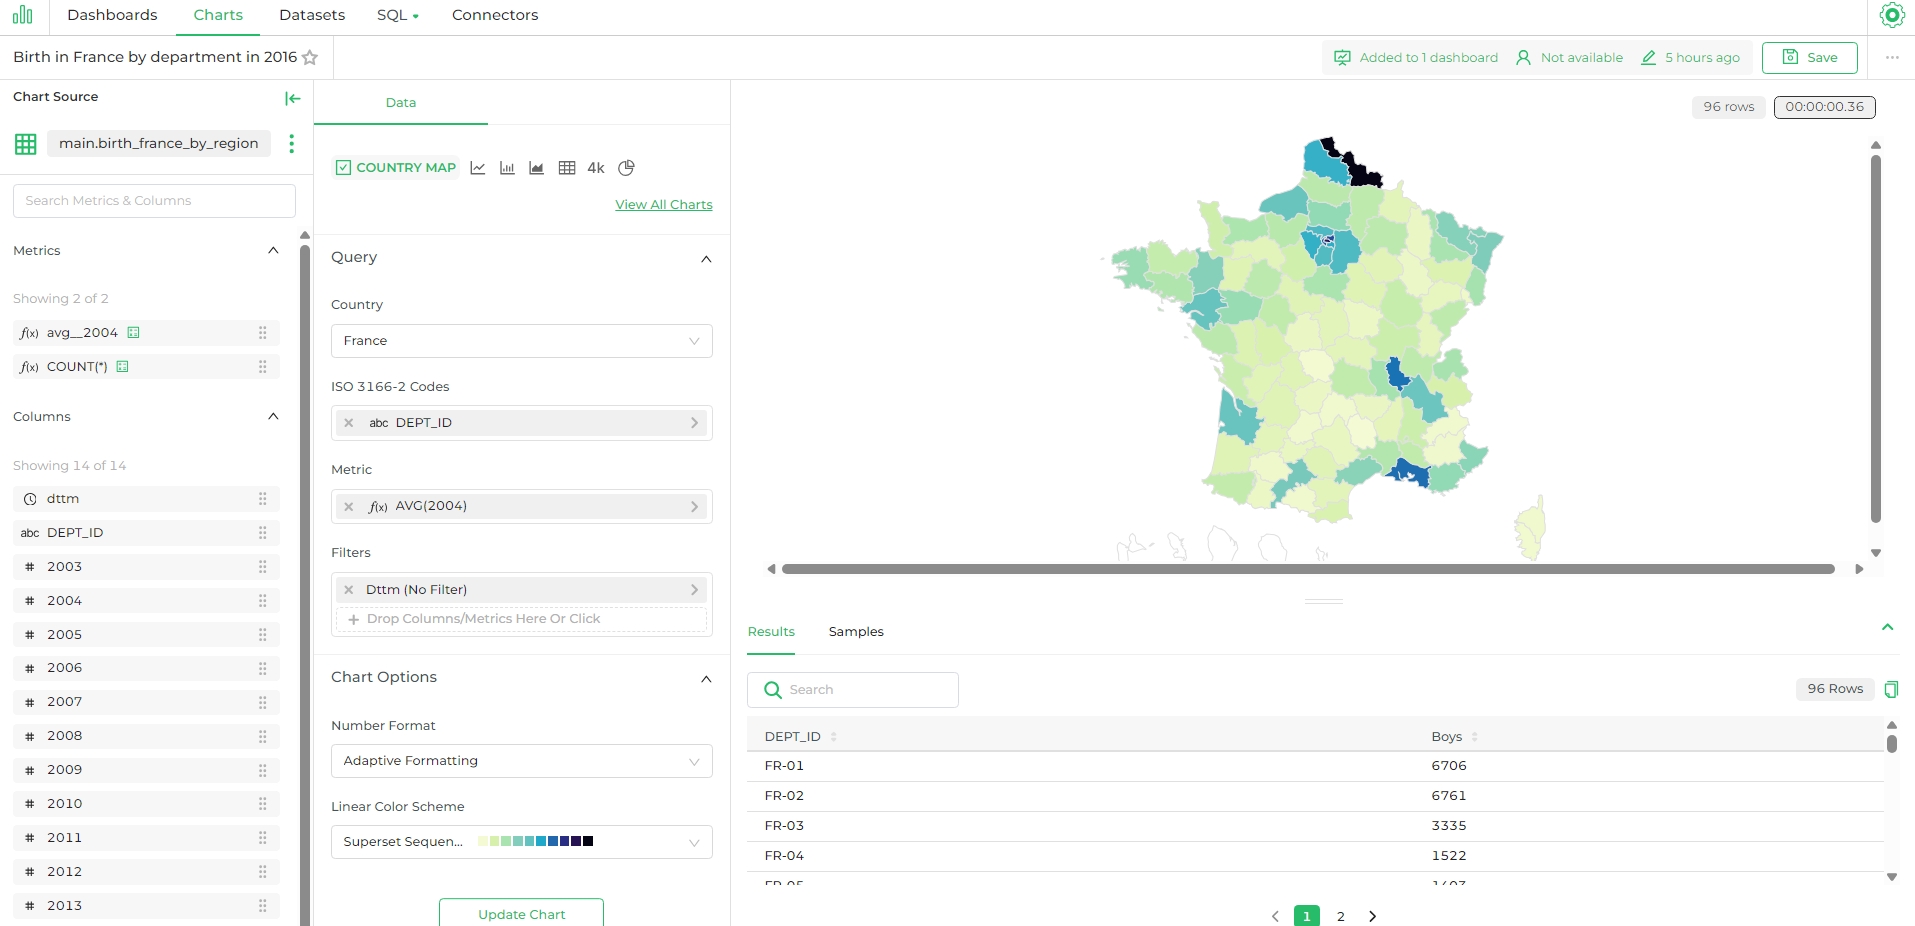
When you are satisfied with the chart, click Save. Provide a name for the chart and click save again.
4. Building the Dashboard
While saving the chart, you will find an option to save and continue to the dashboard. Alternatively, click the + icon at the top and select Dashboard. This will open a blank dashboard builder, which is straightforward to use.
The builder allows you to create a new chart or select from the list of available charts.
- Drag and drop the chart you created into the builder.
- There are layout elements such as tabs, rows, columns, headers, text, and dividers to enhance your dashboard.
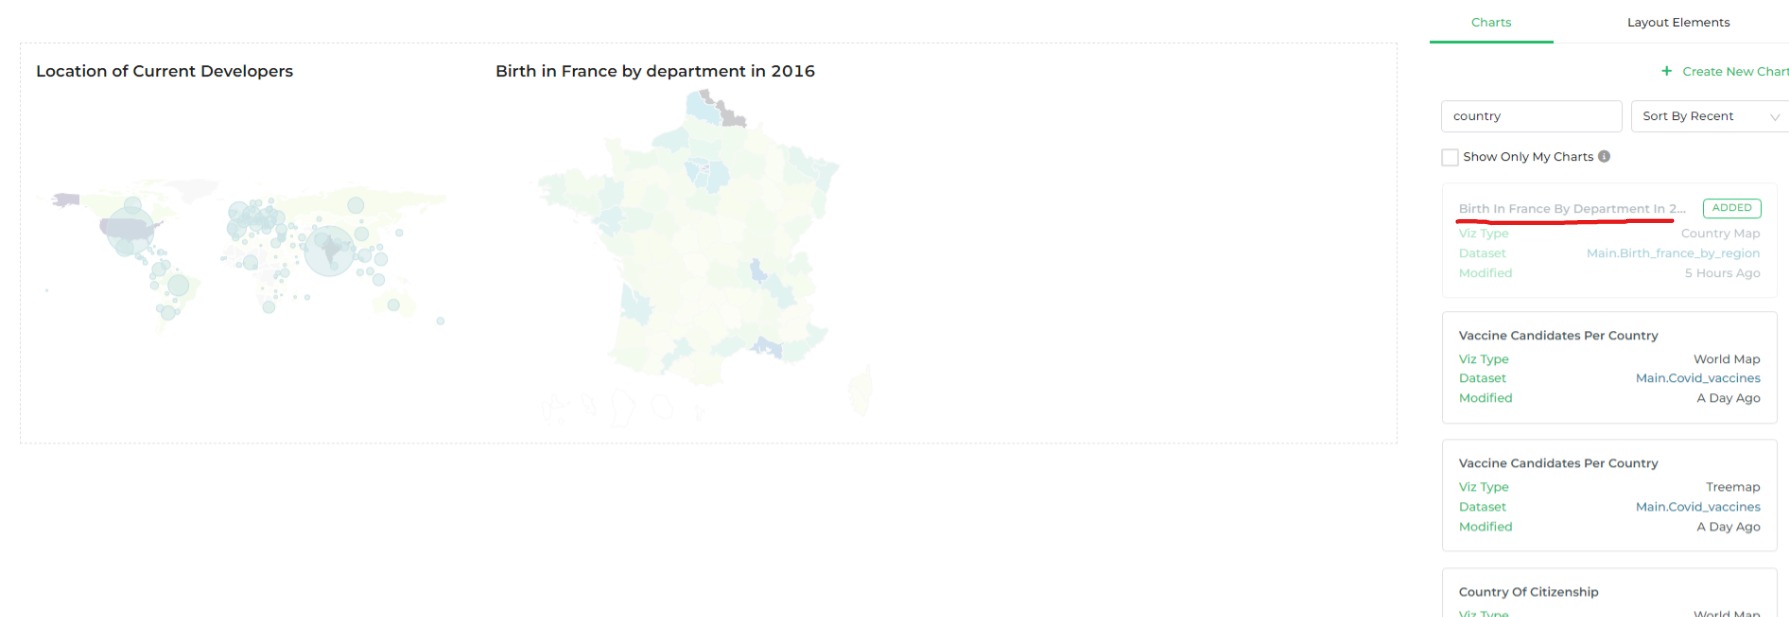
Once you are done, click Save, and your dashboard in DronaHQ will be ready.