Adding Chart to Dataset
Begin your chart creation with a physical or virtual dataset to scale chart building and reuse predefined metrics. Let's see how to start with creating your chart on any dataset available.
Creating a Chart
From Chart Builder
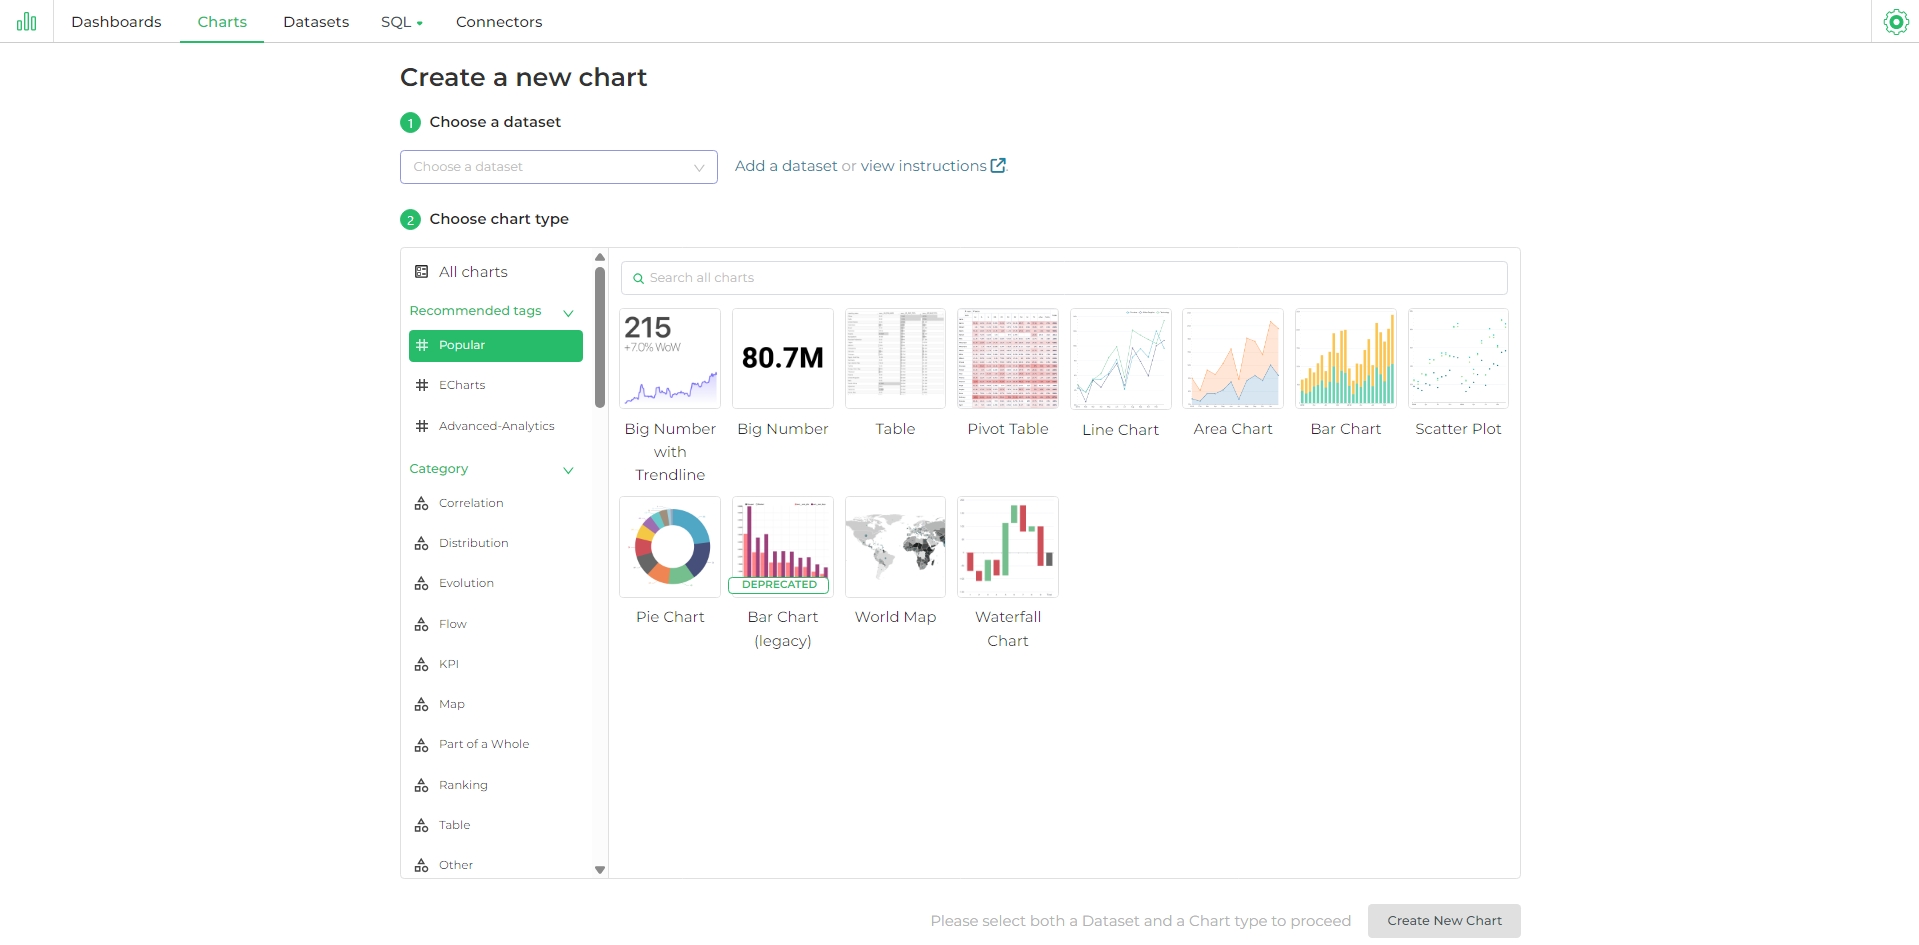
First of. navigate to the Charts section on dashboard and click the + Chart icon. On the "Create a new chart" screen, click the drop-down arrow in the "Choose a Dataset" field and select a dataset.
Now simply choose a chart type and click Create new chart. It is recommended to use charts with the Recommended tag in the chart gallery. You can select the desired chart from the "Create a new chart" dialogue and change the chart type in the Data tab of the Chart Builder.
From SQL Lab - Initiating with a SQL Query
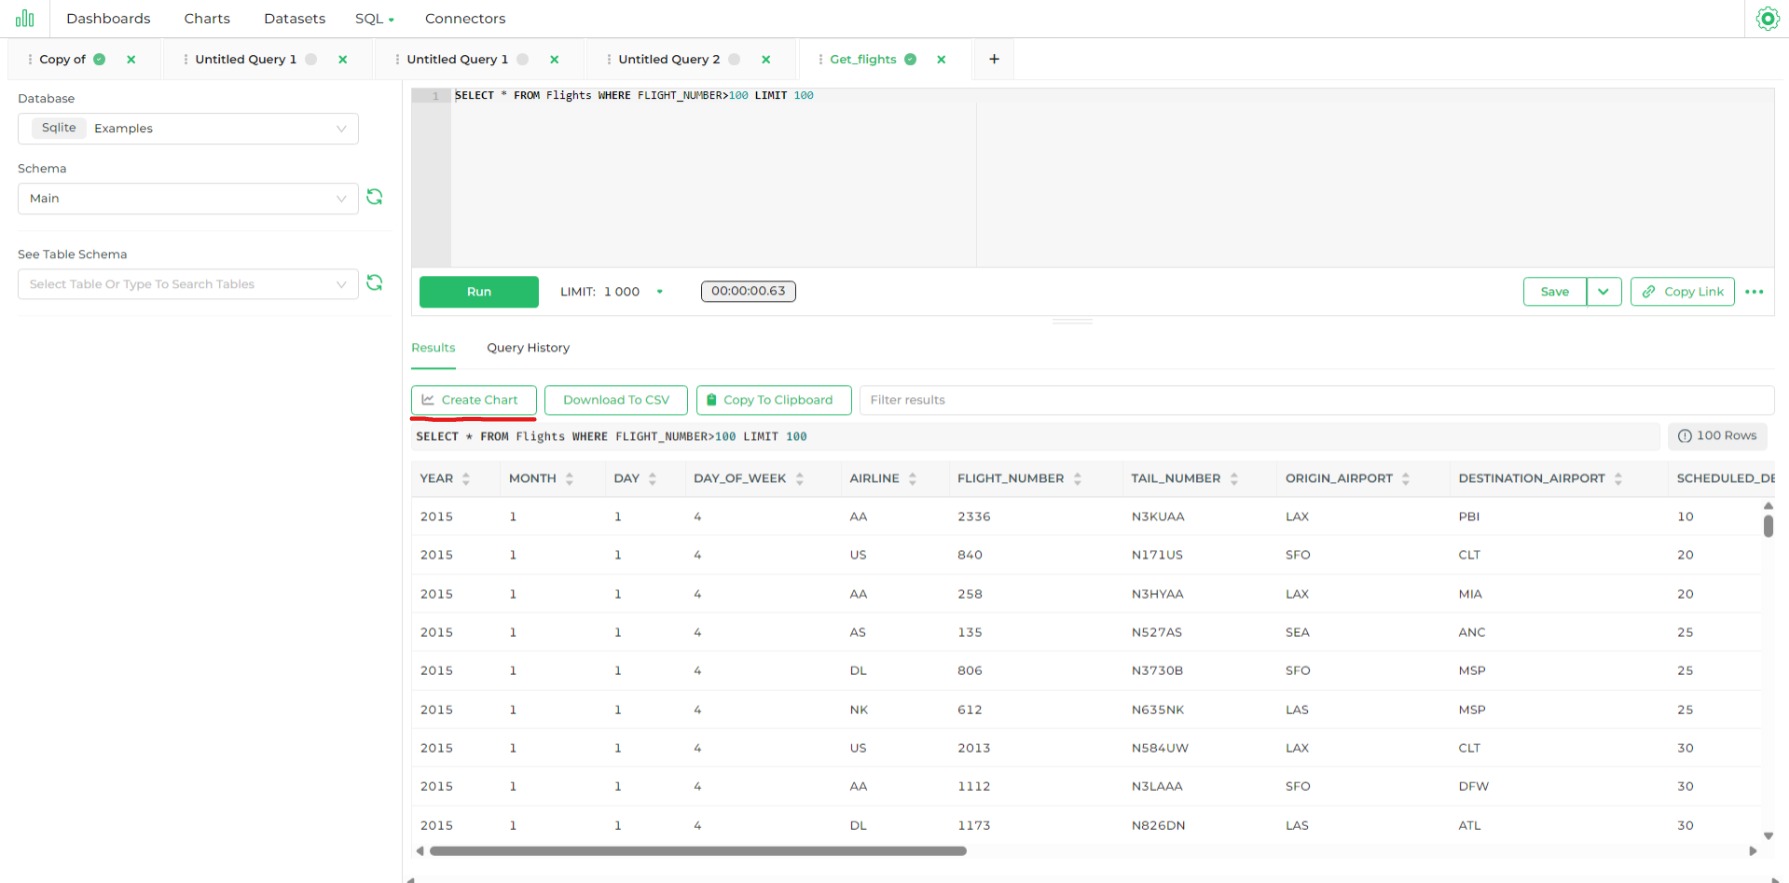
You can begin your chart creation by writing a SQL query, which allows for flexible, ad-hoc data exploration and the definition of new metrics. Here's the process for creating a chart from a SQL query:
Select the appropriate data source from the left-hand side. Enter your SQL query in the provided text box.
- Click
Runto execute the query and reveal theCreate Chartbutton.
- Click
- Once the query runs successfully, click
Create Chartto proceed.
Using Chart Builder
Familiarize yourself with the Chart Builder page to configure a chart and run a query. Verify your chart source before creating any chart. Editing a pre-saved dataset directly from the Chart Builder will affect all charts using the same dataset.
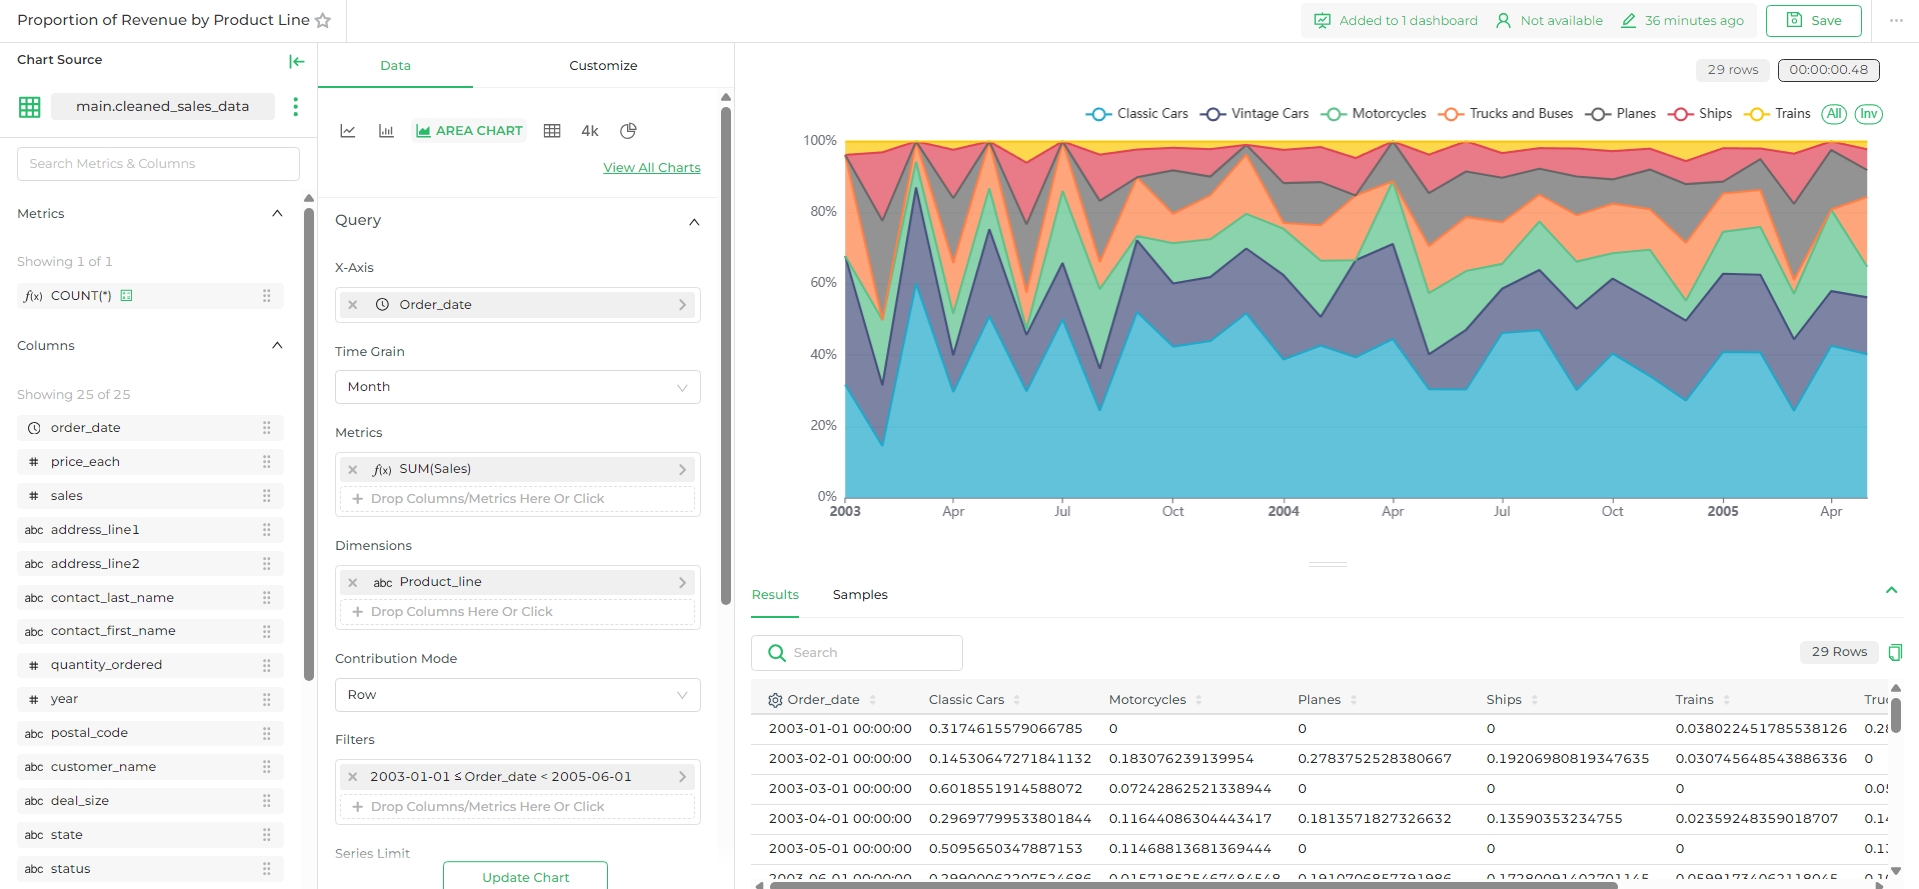
Metrics & Columns Panel:
- Below the Chart Source panel, use the Metrics and Columns panel to quickly find the necessary data.
- Icons indicate data types:
- ƒ: Function used for metrics
- Clock: Time column
- abc: Text data
- #: Numeric value data
- Drag and drop Metrics and Columns into the Query panel to configure your visualization.
Chart Type Panel:
- Use the Chart Type panel to change your visualization type.
- DronaHQ recommends using charts with the
Recommendedtag. - Switch between common chart types without losing already configured fields.
Configuring Fields:
- Viewing Data Samples: Click
Samplesabove the "Run a query to display results" section to pull raw data in table form. - Choosing the Dimension for the X-axis: Specify the x-axis dimension in the "Query" panel. Support for temporal (time series) and non-temporal x-axis dimensions is available. For temporal datasets, define the granularity of displayed x-axis values.
- Add a Metric or Column: Drag a metric or column to the applicable destination fields. A pop-out window will appear for details.
- Viewing Data Samples: Click
Create Chart: once everything is set, click on
Create Chartit, will run the query and will provide a chart with required details. Most DronaHQ charts are interactive; hover over parts of the chart to see additional details.Further Customizations:
- To customize, select the
Customizetab to see available options for the selected chart type. - Experiment with different chart types and configuration settings to express your data in various ways. Update time ranges or add filters to access more or less data.
- To customize, select the
Saving and Sharing the Chart
At the top right of Chart Builder, select Save. In the Save chart dialogue, you can create a new dashboard and add the chart to it.
For sharing and other options, next to Save, click the meatballs icon for chart tools. you will find that to share a chart there are options like, share the chart by
- Copy the chart permalink.
- Share chart by email.
- Share by embed.