Creating Datasets
Datasets in DronaHQ Dashboard are curated representations of data from your database. They enable the creation of charts with unified metric definitions, ensuring consistency and accuracy. Datasets are crucial as every chart in DronaHQ Dashboard is created from a dataset. They offer flexibility in modeling data, allowing you to present information tailored to specific audiences in charts or dashboards.
In this article, we will explore how DronaHQ Dashboard works with your data to create and manage datasets effectively.
A dataset in DronaHQ Dashboard is an abstraction that points to data in your database. This data is then used to create charts.
How to Use a Dataset
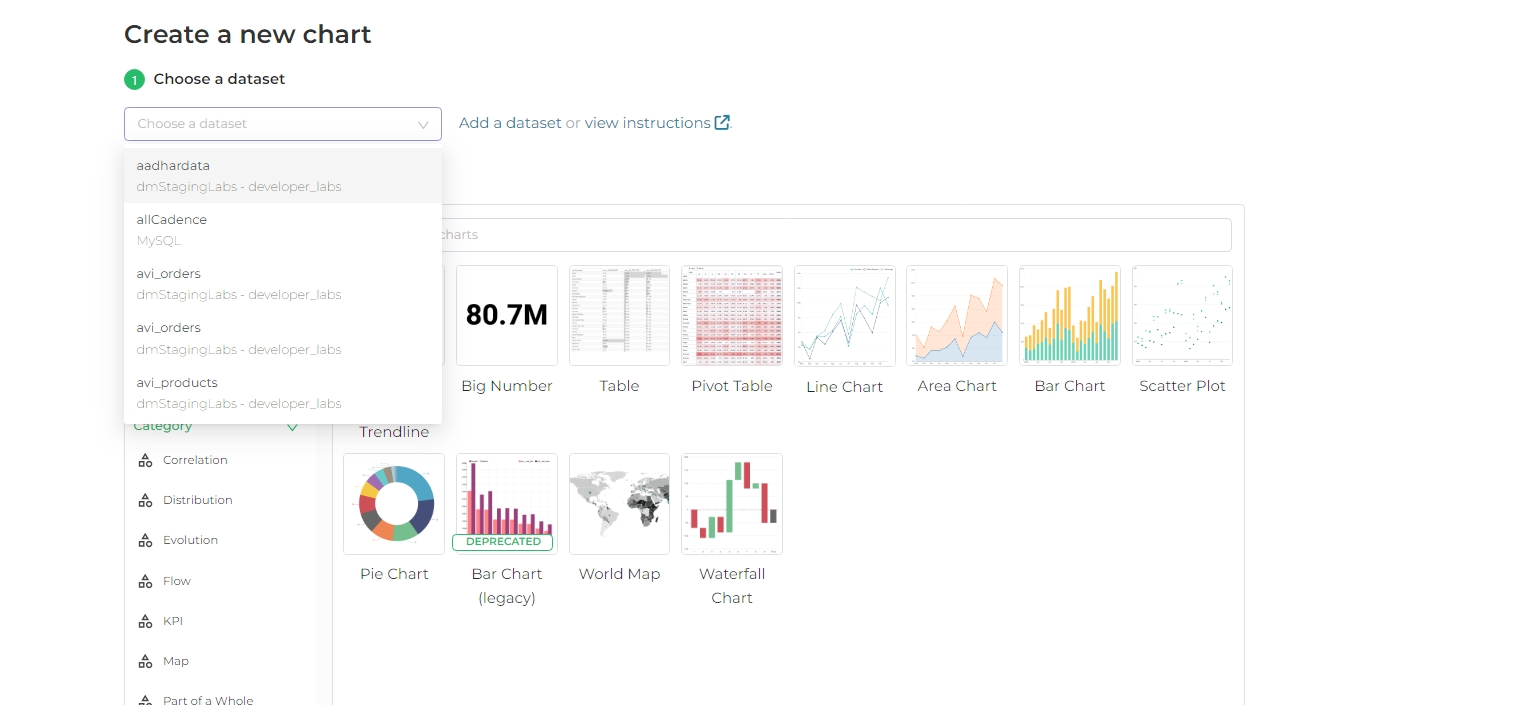
The primary purpose of a dataset is to enable chart creation. You can create a chart in two ways:
Using the Chart Gallery:
- Select a dataset and a chart type from the Chart Gallery screen.
- Configure the chart accordingly.
Using the Explore Interface:
- Select a dataset from the Datasets screen.
- Use the Explore interface to configure your chart.
Physical Datasets
Physical datasets are tables in your connected database. Adding a physical dataset is a quick way to get started with chart creation in DronaHQ Dashboard.
Adding a Physical Dataset
- Navigate to the Datasets screen.
- Select + Dataset.
- In the drop-down lists, select a database, schema, and a table.
- Click Add.
Your dataset is now ready for chart creation.
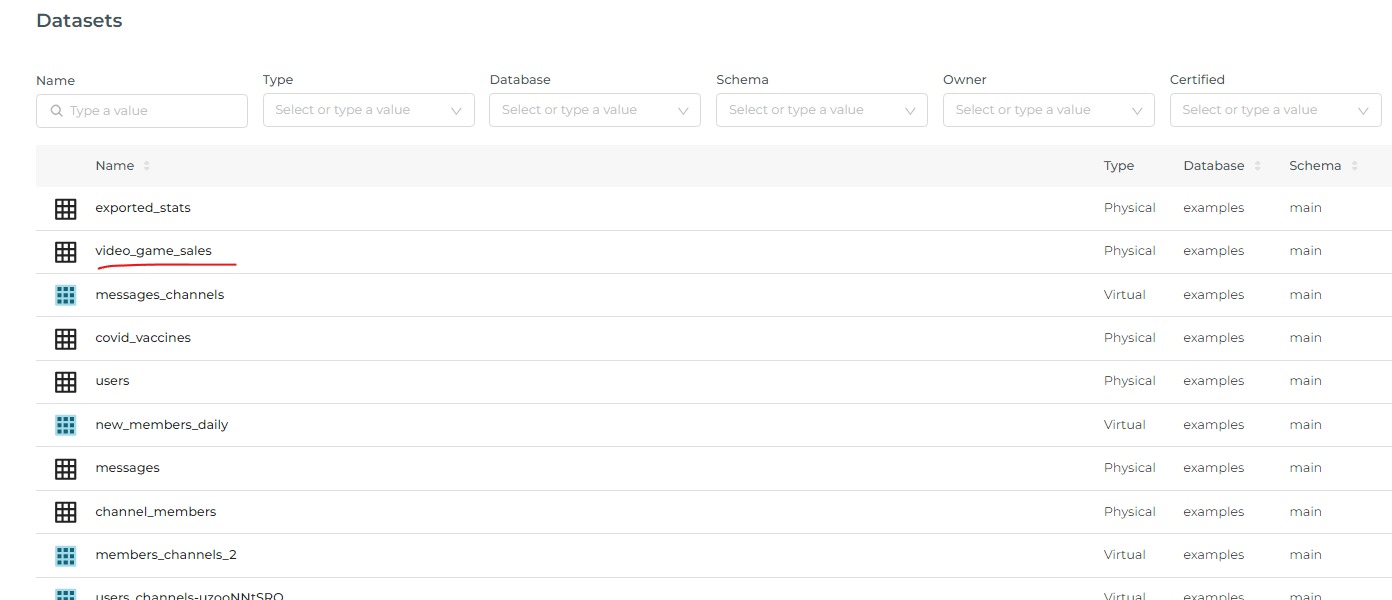
Accessing Physical Datasets
Physical datasets are indicated by black grid icons on the Datasets screen and are designated as "Physical" under the Type column. You can manage, explore, delete, and view these datasets just like virtual datasets.
Virtual Datasets
Virtual datasets are views of data created within DronaHQ Dashboard using SQL Lab. This allows you to use SQL operations like JOIN to build your dataset.
Creating a Virtual Dataset
- Hover over SQL Lab in the Toolbar and select SQL Editor.
- Compose your SQL query and run it.
- Click Save and then Save dataset, followed by providing a name for our new virtual dataset.
- Select Save & Explore to view your query in the Chart Builder.
- Save your data view as a virtual dataset.
Accessing Virtual Datasets
Virtual datasets are indicated by blue grid icons on the Datasets screen and are designated as "Virtual" under the Type column. They can be managed, explored, deleted, and viewed just like physical datasets.
Editing Datasets
Customizing Your Dataset
Datasets added to DronaHQ Dashboard can be customized to align with your specific audience needs. You can define data availability, specify date formats, and change labels.
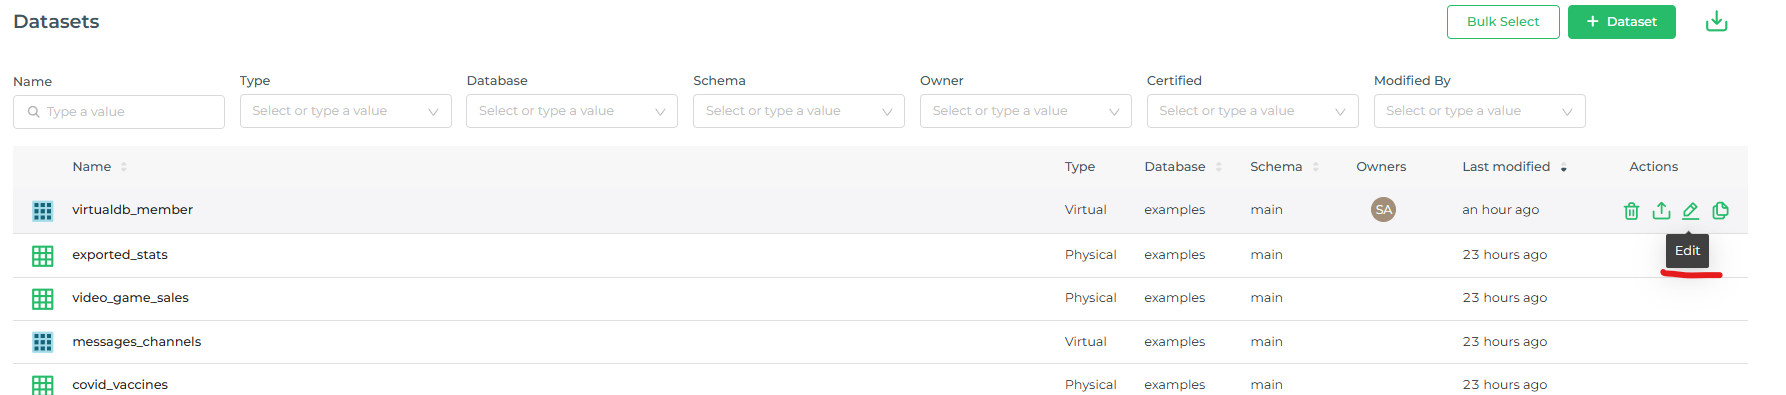
Editing a Dataset
Hover over a dataset row and select the pencil Edit icon under the Actions column.
The Edit Dataset panel will appear.
Source Tab
- Manage the source powering your dataset.
- Specify the type (Physical or Virtual).
- Map it to a database and schema.
- For Physical Datasets, specify the table.
- For Virtual Datasets, set a title and SQL query.
Metrics
Metrics perform operations on a set of data and are used for calculations based on aggregation or pivoting rows to columns.
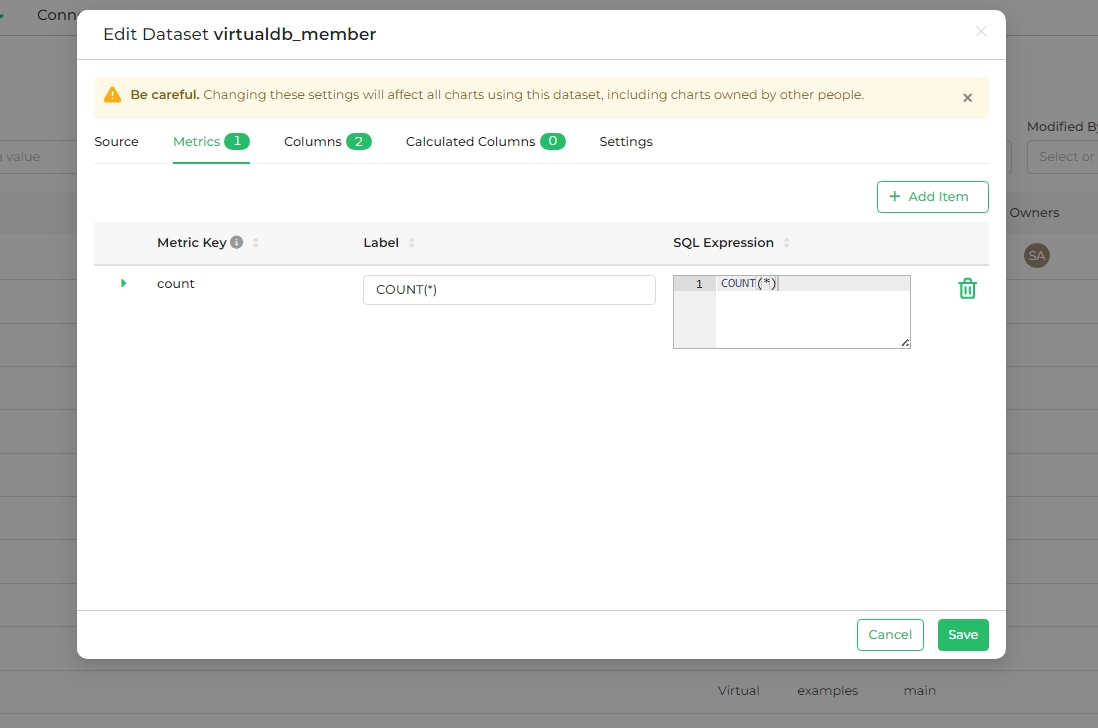
Adding a Metric
- Select the Metrics tab in the Edit Dataset panel.
- Click + Add Item.
- Define the metric details in the new row that appears.
- Click Save.
Fields directly editable on the table include:
- Metric: The name of the metric.
- Label: Text field that displays as the metric's label — this is what the user sees as the metric's name.
- SQL Expression: The SQL expression associated with the metric — this appears as a tooltip when the user hovers over the question mark "?" icon.
To edit other fields associated with the metric, click the expansion arrow on the left side of the metric row.
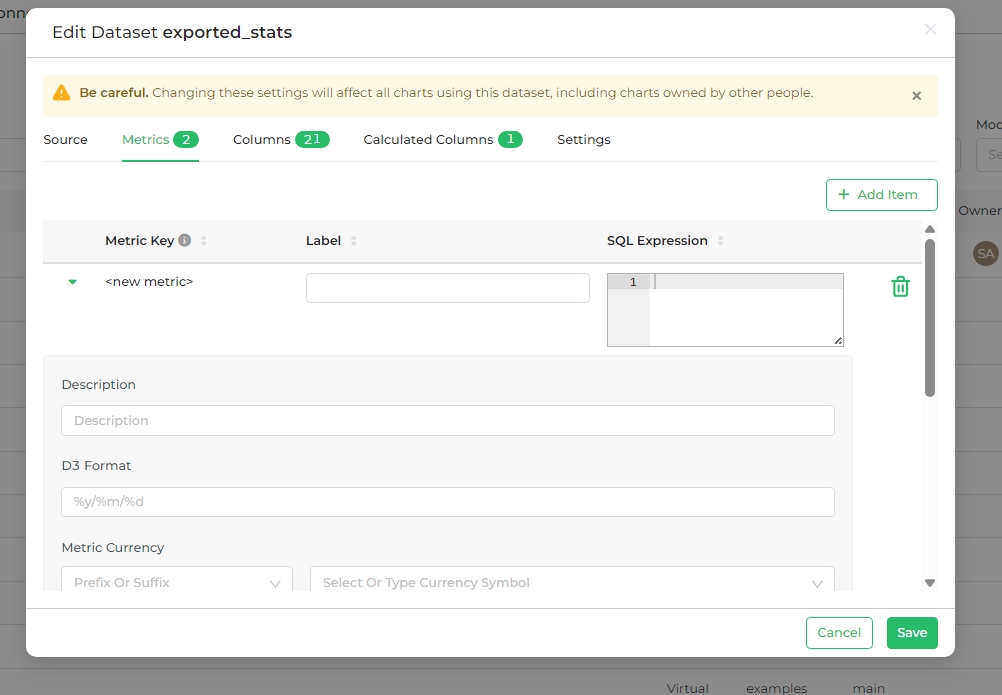
The editable fields here include:
Label: A text field displaying the metric's label, which is what users see as the metric's name (same editable field in the collapsed metric row).
Description: A short description of the metric, shown as a tooltip when users hover over the "i" icon.
D3 Format: Format values using the D3 format. Example:
- Given a value of 1234.567:
.2%= 123456.7%.2k= 1K,.2r= 1,200
- Given a value of 1234.567:
Metric Currency:
- Prefix / Suffix: Choose whether the currency symbol appears before (Prefix) or after (Suffix) the number.
- Currency: Select a currency from the drop-down or type the three-letter abbreviation for the currency (e.g., "AUD" for the Australian Dollar).
Currency formatting is supported in the following chart types:
- Table
- Pivot Table
- Big Number
- Big Number with Trendline
- Series Echarts
- Pie
- Gauge
- Funnel
- Treemap
Certified By: Name of the certifying organization or person.
Certification Details: Details about the certification.
Warning: A warning message that appears in the Metric selection field, if defined.
Columns
The Columns tab displays all column data within the dataset.
Editing Columns
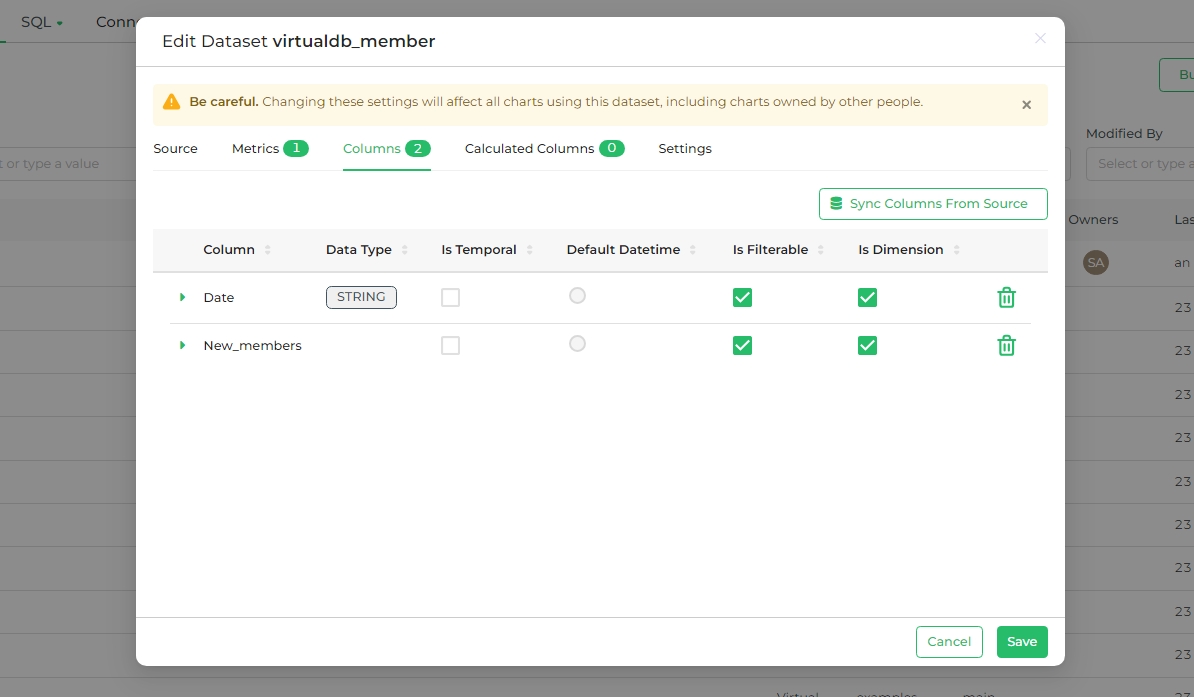
- Select the Columns tab in the Edit Dataset panel.
- Edit fields like Column name, Data type, and more.
The Columns tab presents all column data in the dataset in a tabular format.
The table headings are:
- Column (editable): Shows the column's name.
- Data type: Indicates the type of data in the column (e.g., integer, float, variable character, timestamp, etc.).
- Is temporal (editable): Check this box to mark the column as a timestamp, making it available in the Time panel.
- Is filterable (editable): Check this box to make the column available as an option in the Filter field.
- Is dimension (editable): Check this box to include the column as an option in the Group By field.
- Delete: Click the trash can icon to remove the column.
Select the expansion arrow on the left side of the column row to define additional column data.
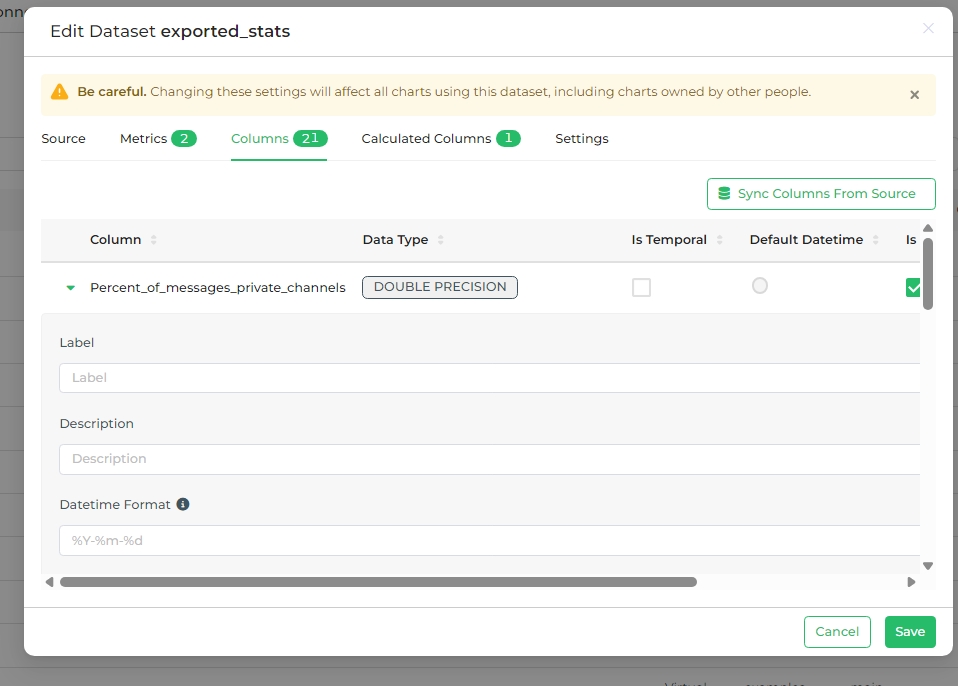
Editable fields here include:
- Label: Change the column's label — this is what users see as the column's name.
- Description: Enter a brief description of the column, which appears as a tooltip when users hover over the "i" icon.
- Datetime Format: Specify the date and time format in Python syntax. Examples:
%m-%d-%Y= 02-27-2020%a %d, %y= Tue 2, 2020%x %X= 02/27/2020 17:41:00%B-%Y= February-2020Epoch_m= If the date is an epoch integer
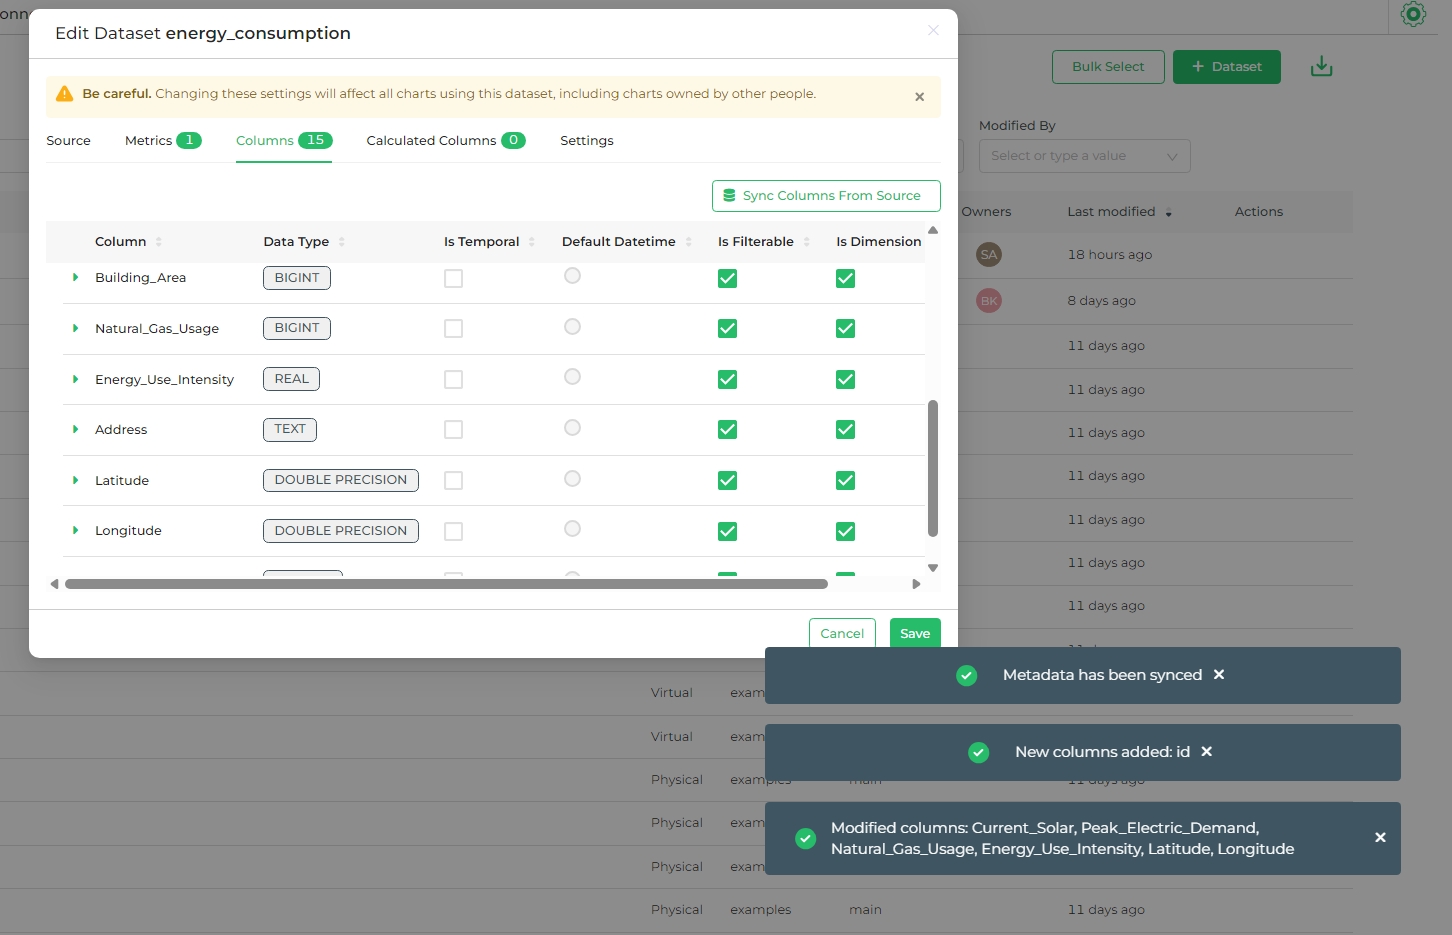
Sync Columns from Source
The Sync Columns from Source button fetches updated metadata from the dataset source, reflecting changes to the columns.
Calculated Columns
Calculated columns refine raw data into a more meaningful format for end-users. They are created using SQL expressions and are not available in SQL Lab. Let's discuss some concepts behind Calculated Columns. These columns are used for data munging, which involves refining raw data into a more meaningful format for end-users, aimed at providing valuable information based on the audience.
Examples of data munging methods include:
- Data Transformation: Changing data to different formats.
- Data Enrichment: Adding meaningful information to the data.
- Data Validation: Correcting and validating data.
Calculated Columns are implemented using SQL expressions in SQL statements, but they are not available in SQL Lab.
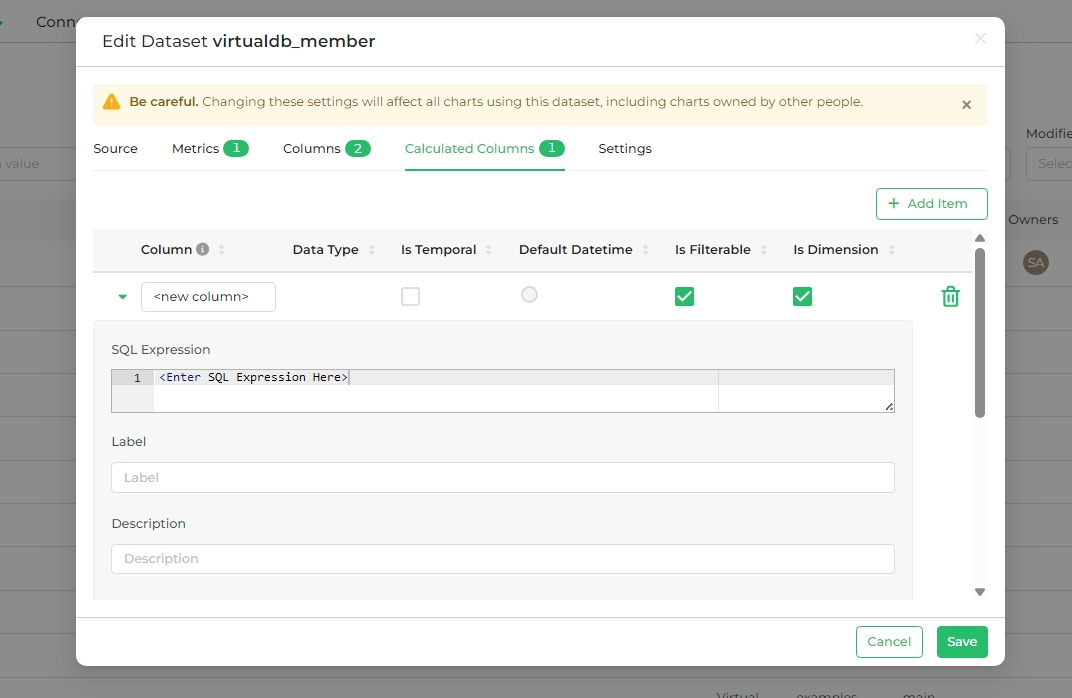
The Calculated Columns tab presents all calculated column data within the dataset in a table format.
The table headings are:
- Column (editable): Displays the name of the column.
- Data type: Shows the type of data within the column (e.g., integer, float, variable character, timestamp, etc.).
- Is temporal (editable): Check this box to mark the calculated column as a timestamp, making it available in the Time panel.
- Is filterable (editable): Check this box to include the calculated column as an option in the Filter field.
- Is dimension (editable): Check this box to include the calculated column as an option in the Group By field.
- Delete: Click the trash can icon to delete the calculated column.
To define additional data, click the expansion arrow on the left side of the calculated column row.
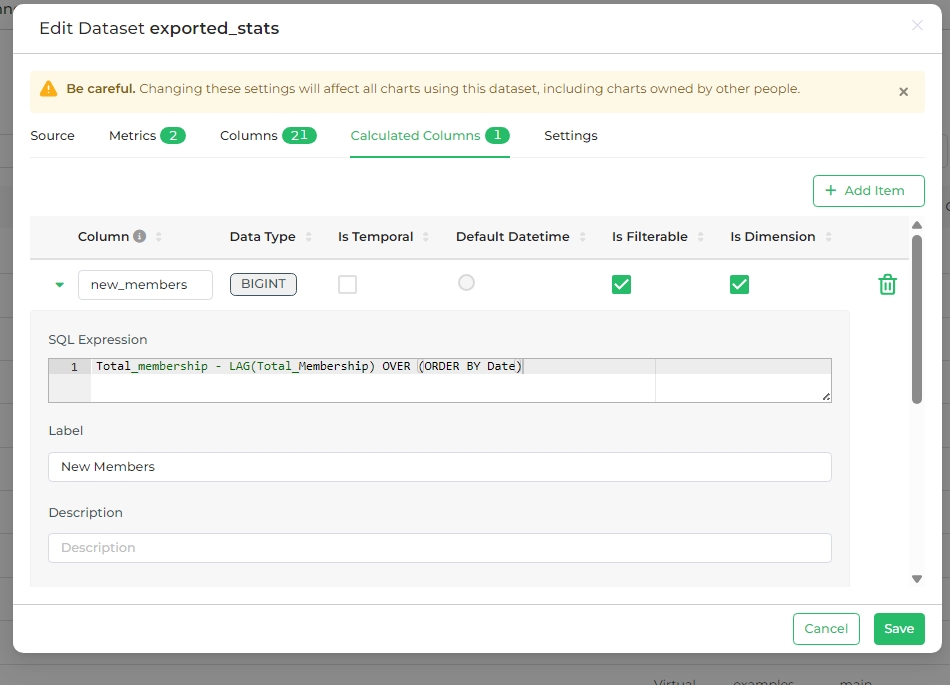
Editable fields here include:
- SQL Expression: The SQL expression associated with the calculated column, shown as a tooltip when users hover over the question mark "?" icon.
- Label: Change the column's label, which is what users see as the calculated column's name.
- Description: Enter a brief description of the calculated column, appearing as a tooltip when users hover over the "i" icon.
- Data Type: Displays the type of data within the column (e.g., integer, float, variable character, timestamp, etc.).
- Datetime Format: Specify the date and time format in Python syntax. Examples:
%m-%d-%Y= 02-27-2020%a %d, %y= Tue 2, 2020%x %X= 02/27/2020 17:41:00%B-%Y= February-2020Epoch_m= If the date is an epoch integer