Dashboard data - Filtering & Drilling
DronaHQ's Dashboard Filters provide a way to manage data filtering. From any dashboard, you can expand the Filters sidebar to effortlessly apply multiple filters across all charts within that dashboard.
The "Value" filters allow you to specify values for any column in your dataset, offering great flexibility with various filter options. "Numerical range" filters let you easily define a range for numeric values, such as pricing or years. Additionally, Dashboard includes several time-based filters—Time Range, Time Column, and Time Grain—that enable you to filter all charts according to the time column in your dataset.
With both basic and advanced configuration settings, you can enhance your filter options and improve usability.
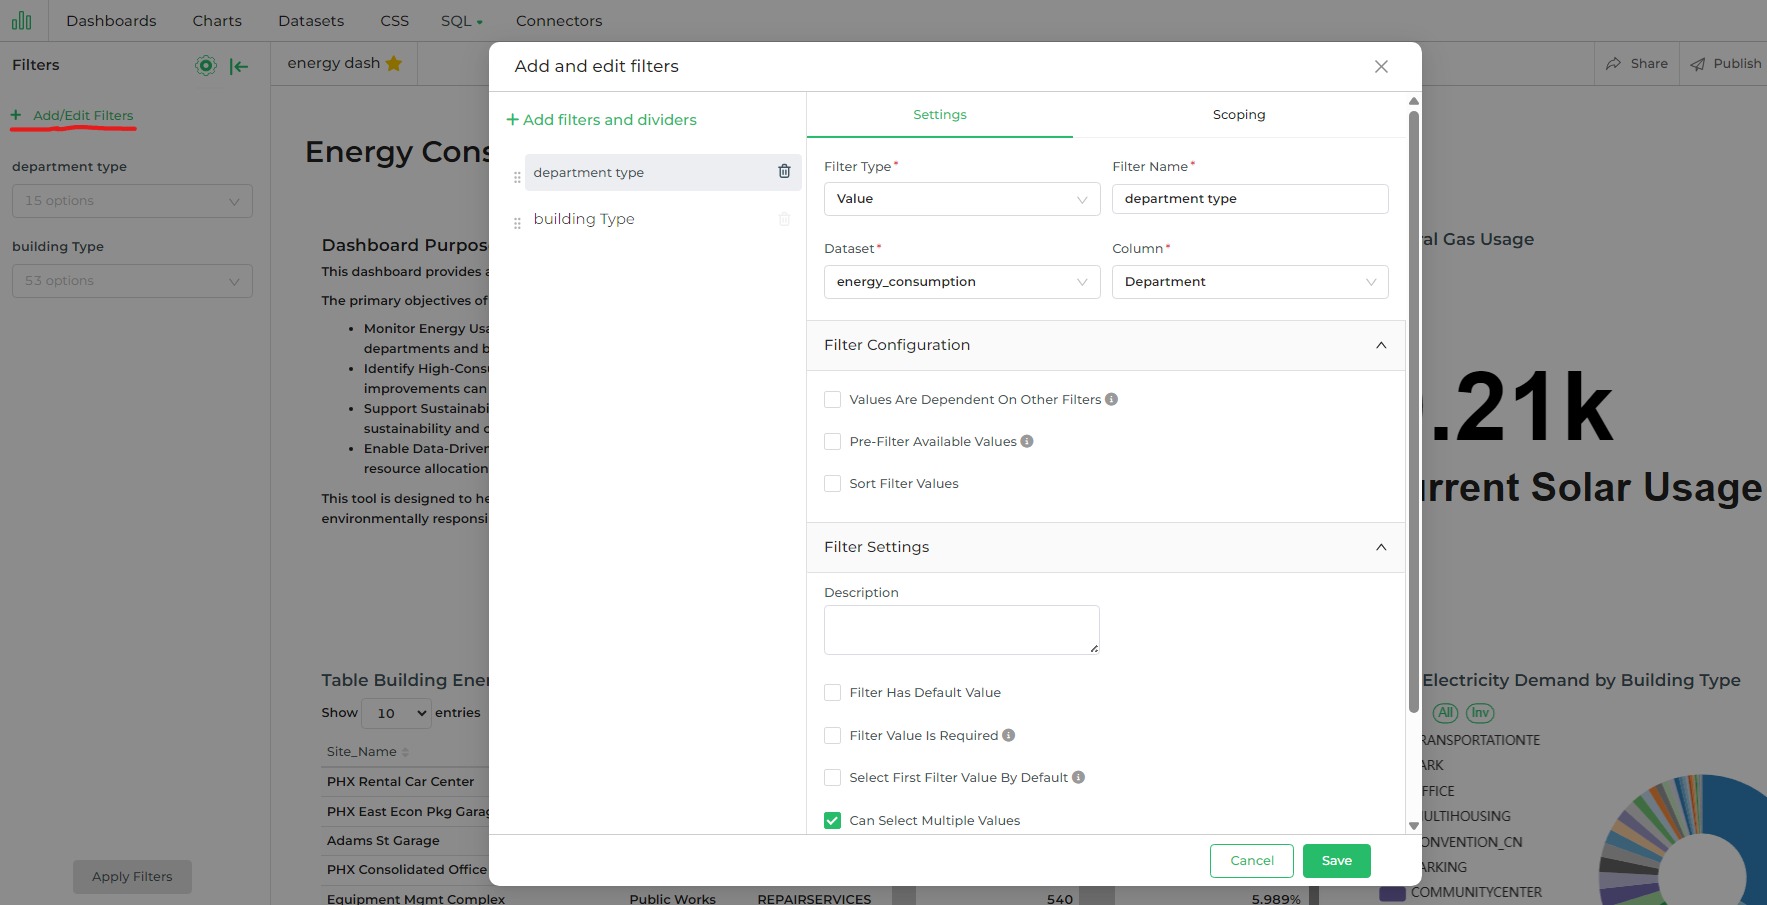
Different Filter Types
In the Add and edit filters window, under the Settings tab, there are several sections. The first section consists of
four essential fields:
Filter Type: Choose a filter type from the available options, which include Value, Numerical Range, Time Range, Time Column, and Time Grain (detailed descriptions provided below).
Filter Name: Provide a brief, descriptive name for the new filter. This name usually reflects the choice made in the following Column field.
Dataset: Select the dataset that will be used for the charts within the dashboard. By default, all datasets linked to the dashboard's charts are available for selection. This option appears when the Value, Numerical Range, Time Column, or Time Grain filter types are chosen.
Column: Choose the column to which the filter will apply. This option is available when either the Value or Numerical Range filter types are selected.
Now, let's focus into the four filter types available in the Filter Type field.
Value Type
This filter type generates a drop-down menu that displays all available values from the selected column (as specified in the Column field).
For example, if you select the Value filter type and then choose the "Department" column, a drop-down filter menu labeled "Department" will appear on the dashboard. This menu allows you to filter the data displayed in all charts by the selected department. When the filter is applied, only the data relevant to the chosen department will be visible across all charts in the dashboard.
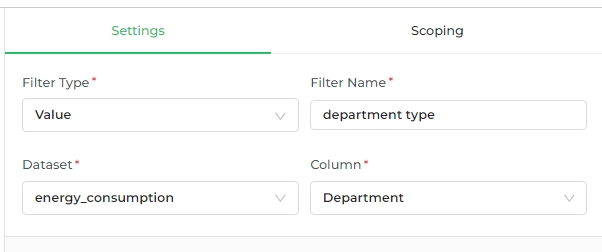
In this case, if you select a specific department, the dashboard will update to show data only for that department after you apply the filter.
Numerical Range
This filter type generates a range slider that allows you to define a start and end point based on the numerical values in the selected column.
For example, if you choose the "Numerical range" filter type and then select the "Electricity_Usage" column, a range slider will appear. This slider enables you to set a specific range of electricity usage. Once applied, all charts within the dashboard will display data corresponding only to the selected electricity usage range.


In this case, if you adjust the slider to a particular range, the dashboard will update to show data only within that range after applying the filter.
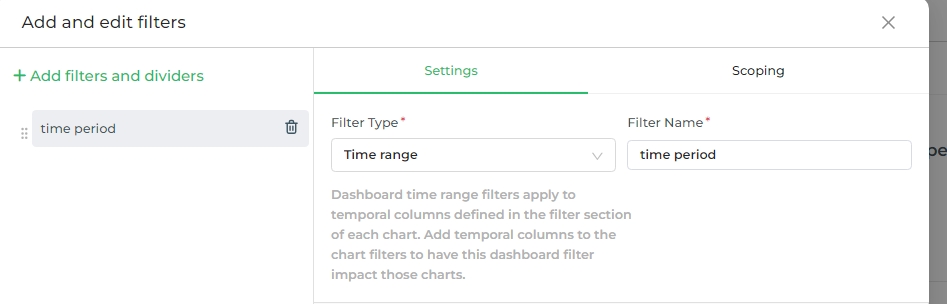
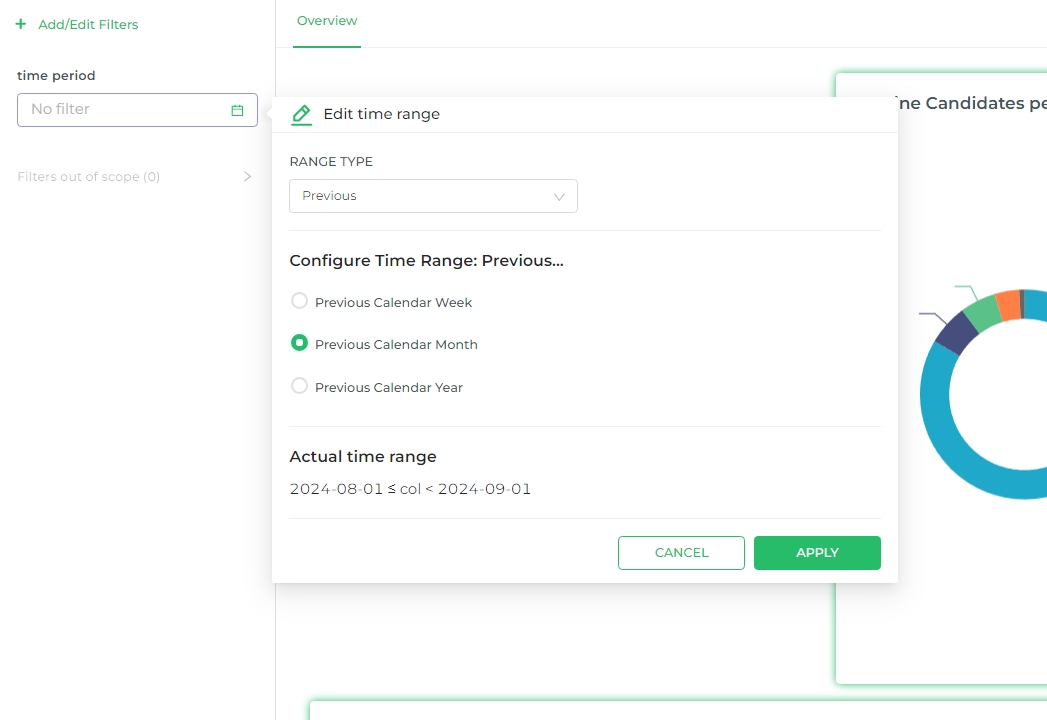
Time Range
This filter type generates a button that, when clicked, opens the Edit Time Range functionality. This feature is the same as the Time Range option used when creating a new chart.
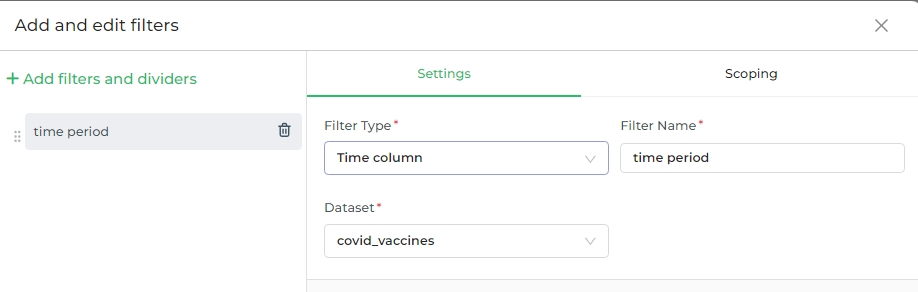
Time Column
This filter type generates a drop-down menu that allows you to select a new dashboard-level time column, which will override any existing time columns defined at the chart level.
When should you use this filter type? The Time Column filter is ideal when your dataset contains multiple time columns. If your dataset only has one time column (which is automatically selected), this filter type may not be necessary.
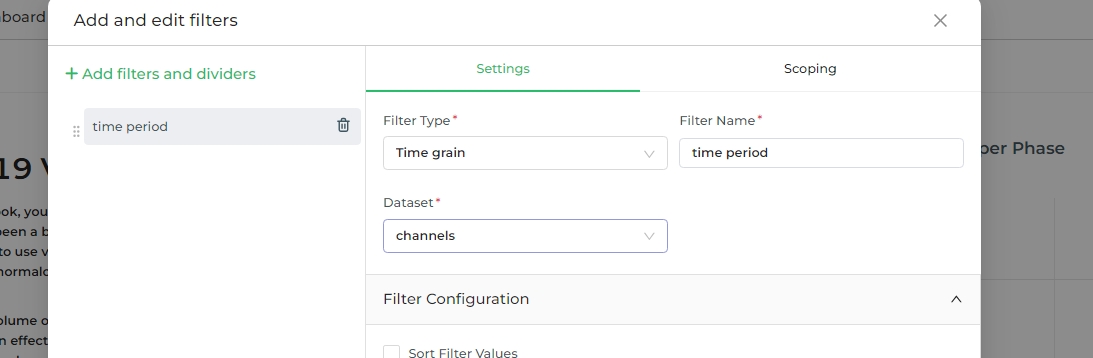
Time Grain
This filter type creates a drop-down that enables you to select a time granularity. When applied, all timestamps are grouped based on the selected time grain.
In the Scoping tab, there are two radio options, to determine the scope of the filter we are creating. User can select
between:
- Apply to all panels - This will make sure that all panels with this column will be affected by this filter.
- Apply to specific panels - With this option only selected panels will be affected by this filter.
Parent - Child Filter
By using the Values are dependent on other filters configuration option we can apply a parent-child type relationship
between filters. This configuration turns an existing filter into a sub-filter of a parent.
| Feature | Value | Numerical Range | Time Range | Time Column | Time Grain |
|---|---|---|---|---|---|
| Parent-child | ✔ | ||||
| Pre - Filter available values | ✔ | ✔ | |||
| Sort filter values | ✔ | ✔ | ✔ | ✔ | |
| Single value | ✔ |
Values are dependent on other filters
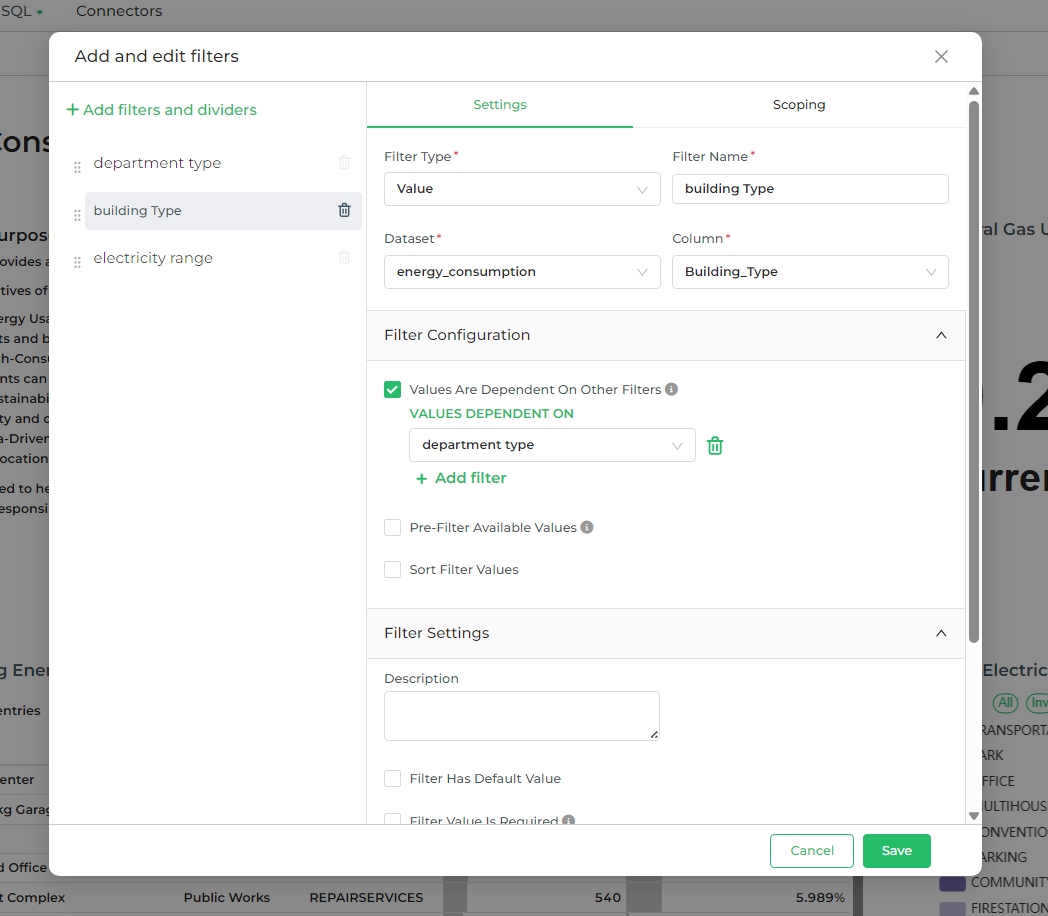
let's have a closer look at how the configuration option works. This option is used to turn a filter into a sub-filter
of an existing filter. In this example, we will make the building_Type filter a sub-filter of the department_type
filter (i.e., the department type filter becomes the parent).
The idea is to allow users to first select a department, and then refine their selection further by choosing a building type within the selected department.
To start, select the building_Type filter and, in the Filter Configuration panel, check the
Values Are Dependent On Other Filters option.
After doing this, a Values Dependent On drop-down menu appears — now go ahead and select department_type as the
parent filter and then click Save.
Pre - Filter Data
What if you want to limit the available values in a filter based on specific criteria before users interact with it?
That's where the Pre - Filter Available Values option comes in.
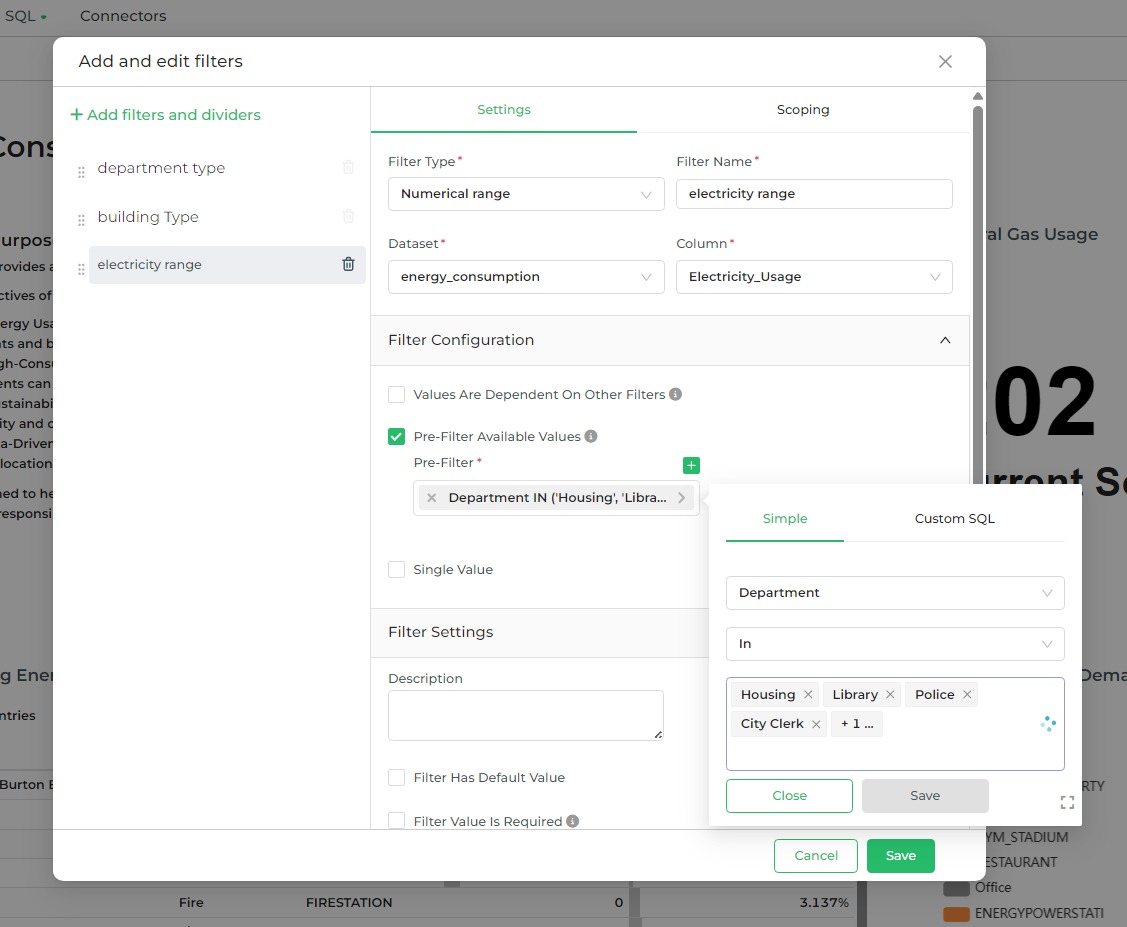
This option is used to limit the available values in a filter based on a pre-defined condition. In this example, we will
apply a pre-filter to the electricity_usage filter, restricting the available values based on the selection of
department_type.
The idea is to allow users to only see electricity usage data for specific departments, such as Housing, Library, Police, and City Clerk, as defined by the pre-filter.
To start, select the electricity_usage filter and, in the Filter Configuration panel, check the
Pre-Filter Available Values option.
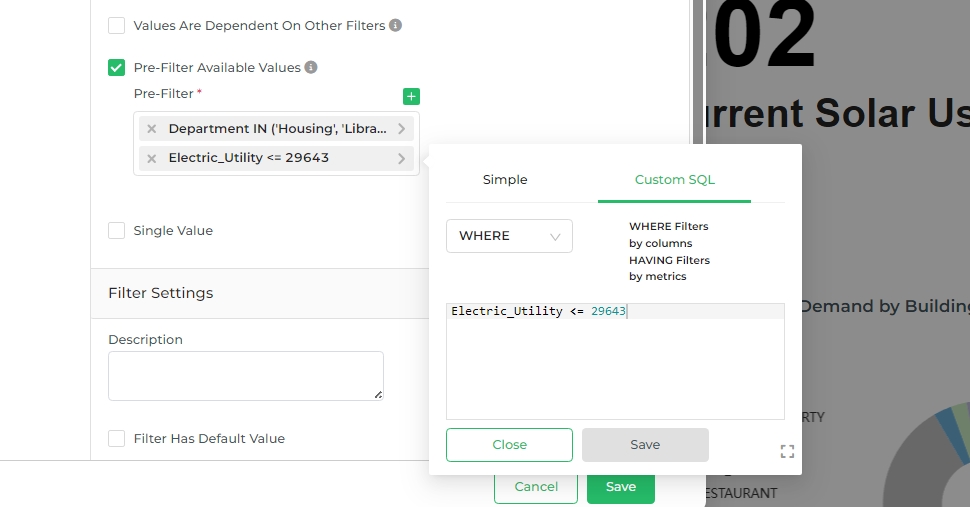
After doing this, a Pre-Filter field appears — now go ahead and select Department as the field, set the condition to
IN, and choose departments you want to include, such as Housing, Library, Police, and City Clerk. Then click Save.
We can add multiple Pre-Filter(s), for a single filter creation. Also can write Custom SQL for filter configuration.
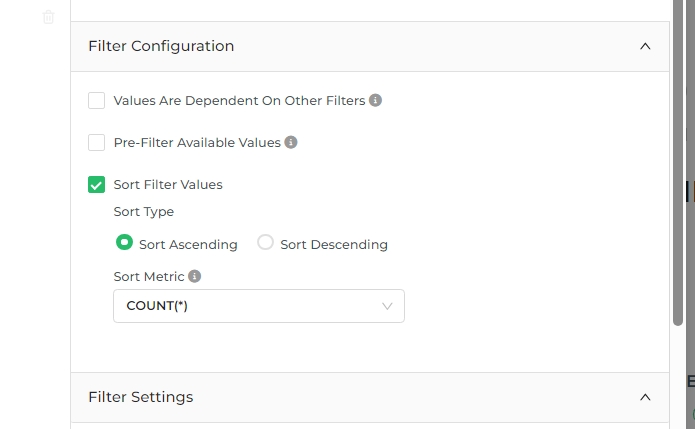
Sort - FIlter Data
Option is available for these Filter Types: Value, Time Range, Time Column, Time Grain
The Sort Filter Values option allows you to organize the values in a filter either in ascending or descending order.
You can also choose to sort based on a specific metric from the dataset.
To use this feature, simply check the Sort Filter Values option, then select whether the sorting should be in
ascending or descending order. Additionally, you have the option to sort by a metric available in the dataset.
Single Value data filter
The Single Value option allows you to restrict the filter to select just one value from the available range. You can
specify the type of single value to be chosen—whether it should be the minimum, exact, or maximum value within the
filter's range.
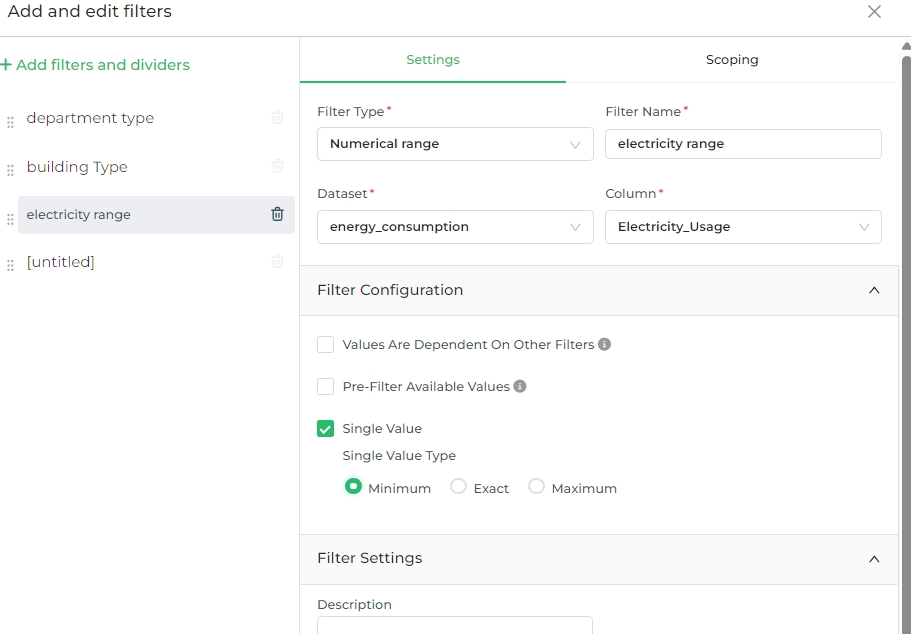
To use this feature, check the Single Value box, and then select one of the following options:
- Minimum: Selects the lowest available value.
- Exact: Allows users to choose an exact value from the available options.
- Maximum: Selects the highest available value.
This configuration is useful when you want to enforce that only one specific value is used in the filter, ensuring clarity and precision.
Filter Settings
Here's the table with the available settings for each filter type:
| Setting | Value | Numerical Range | Time Range | Time Column | Time Grain |
|---|---|---|---|---|---|
| Description | ✔ | ✔ | ✔ | ✔ | ✔ |
| Default values | ✔ | ✔ | ✔ | ✔ | ✔ |
| Value required | ✔ | ✔ | ✔ | ✔ | ✔ |
| Select first value by default | ✔ | ||||
| Select multiple values | ✔ | ||||
| Dynamic search | ✔ | ||||
| Inverse selection | ✔ |
Description
The "Description" setting allows you to add explanatory text or labels to filters, helping users understand the purpose or function of each filter. This can enhance usability by providing context or guidance on what kind of values are expected or what the filter will accomplish.
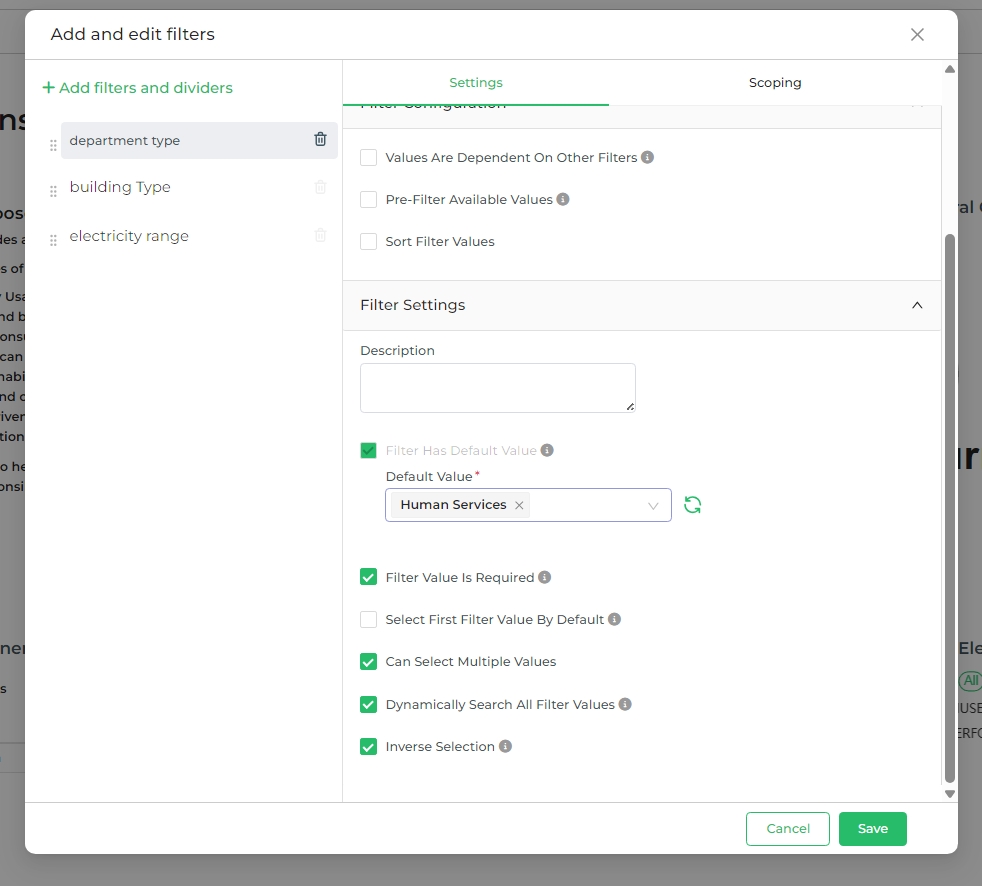
Filter has Default Value(s)
The Filter has default value setting enables you to pre-select a default value for a filter when it is first applied.
This is useful when you want certain values to be automatically chosen by the filter, saving users from having to
manually select them. For example, if you have a filter for Department Type and set Human Services as a default
value, users will see Human Services selected by default when they first interact with the filter.
Filter Value is Required
When the Filter value is required option is enabled, users must specify a value for the filter before they can apply
it. This setting helps prevent incomplete queries and ensures that users provide necessary input, which can improve the
accuracy and performance of data retrieval. It’s particularly useful for avoiding large or unintended queries that might
result from missing filter criteria.
Select First Filter Value by Default
The Select first filter value by default option automatically chooses the first item in a column’s data as the default
filter value. This setting is useful when you want to ensure that a default value is always selected without manual
intervention. For example, if the first item in your Department Type filter is Arts, enabling this option will
pre-select Arts by default, simplifying the user experience.
The Select first filter value by default setting helps avoid accidentally triggering expensive queries on your
dashboard.
For instance, if you’re managing a dataset of flight schedules that are frequently updated, this setting will automatically select the first available flight option. This prevents you from running new queries every time the data changes, saving time and resources.
Can Select Multiple Values
The Can select multiple values setting allows users to choose more than one value from the filter. This option is
beneficial when you want to offer flexibility in filtering, enabling users to select several criteria at once. For
example, in a Tags filter, enabling this setting would allow users to select multiple tags, such as Technology and
Innovation, simultaneously.
Dynamically Search All Filter Values
Please be aware that using this option may add stress to your database.
The Dynamically search all filter values option enables real-time searching within the filter values as users type.
This feature is particularly useful for large datasets with many values, making it easier for users to find and select
the values they need. For example, if you have a filter with hundreds of categories, enabling this setting will allow
users to quickly locate the desired category by typing part of its name.
Inverse Selection
The Inverse Selection setting allows you to exclude specific values from the filter results. Instead of including
certain values, this option lets you filter out the selected ones, showing all other values. For instance, if you select
Arts and Convection genres with inverse selection enabled, the filter will display all genres except these two. This
can be useful for scenarios where excluding a few items is more practical than selecting many.
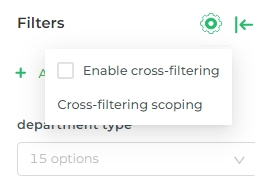
Scoping Filters
Scoping in dashboards allows you to control how filters are applied to specific charts, offering precise management over your data views. To access scoping options, navigate to the Filter Bar, select Add/Edit Filters, and choose the filter you want to modify. From there, go to the Scoping tab.
By default, filters like
- Time Grain apply to all charts, while
- Value, Numerical Range, Time Column, and Time Range filters apply to charts powered by the same dataset.
Scoping enables you to extend filter effects across multiple datasets if they share a common column, such as applying a filter across energy consumption and solar usage data that share a Building_Type field.
Additionally, you can customize scoping by applying filters to specific charts or tabs. Simply select the charts you want filtered, or deselect those you want to exclude from the filtering process. This level of control ensures that your filters are tailored to display exactly the data you need in various sections of your dashboard.
Cross-Filtering Data
Cross-filtering in dashboard enables interactive filtering across multiple charts by allowing data selections from one chart to act as filters for others.
For example, when users interact with a chart, such as selecting a particular department from the "Table Building Energy Metrics by Department," that selection can be applied as a filter across all charts that are compatible with cross-filtering.
Selecting a specific department like Aviation will update the related metrics such as "Current Solar Usage" or "Peak Electricity Demand by Building Type" pie chart. This creates a synchronized view across the dashboard, highlighting data relevant to the selected department, building, or metric.
Eligible Charts for Cross-Filtering
- Table Chart (e.g., energy usage by building)
- Pie Chart (e.g., peak electricity demand)
- Bar Chart (e.g., energy consumption by department)
- Line Chart
- Pivot Table
- Area Chart
- Scatter Plot
- Smooth Line Chart
- Stepped Line Chart
- World Maps
- All charts built with ECharts
Applying Cross-Filters
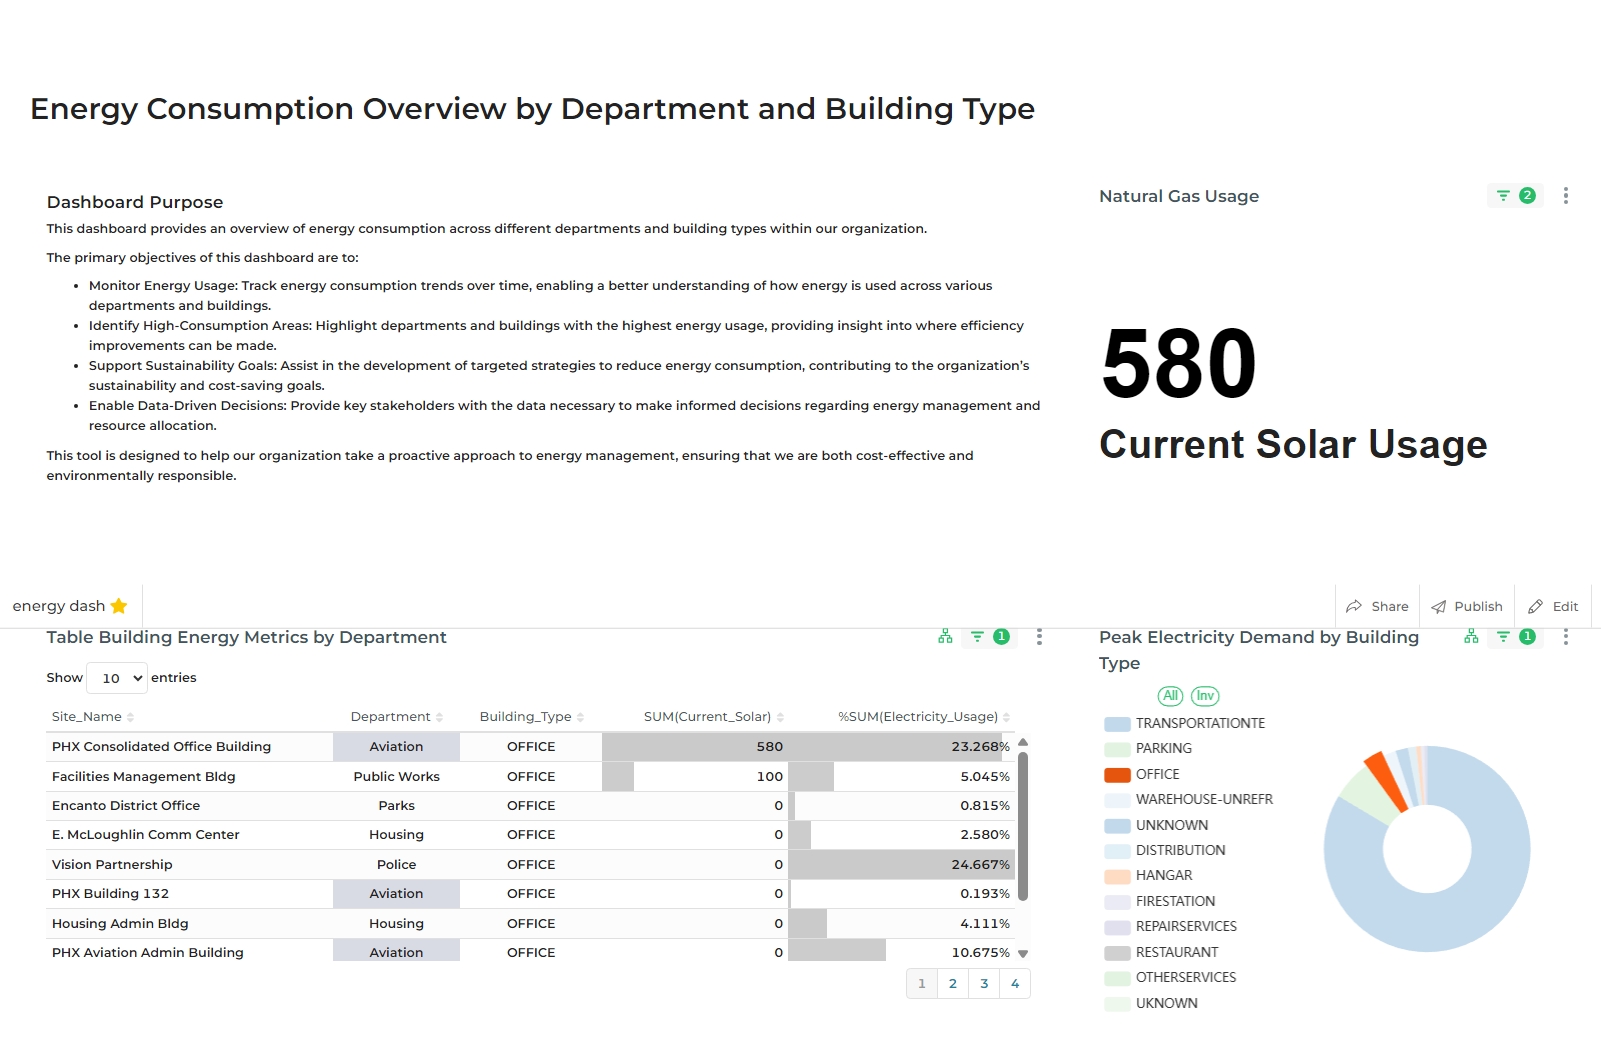
Applying cross-filters is intuitive. Once you select a data point—such as a row in a table or a slice in a pie chart—the cross-filter is automatically applied across the entire dashboard. For instance, selecting the Office category in the pie chart will update the table of energy metrics to display only the energy consumption data for buildings classified under Office.
In the example image, when you select Office as a building type from the pie chart, the table displaying "Building Energy Metrics" and the current solar usage figures will immediately reflect only the Office buildings, providing a focused view of data related to this category.
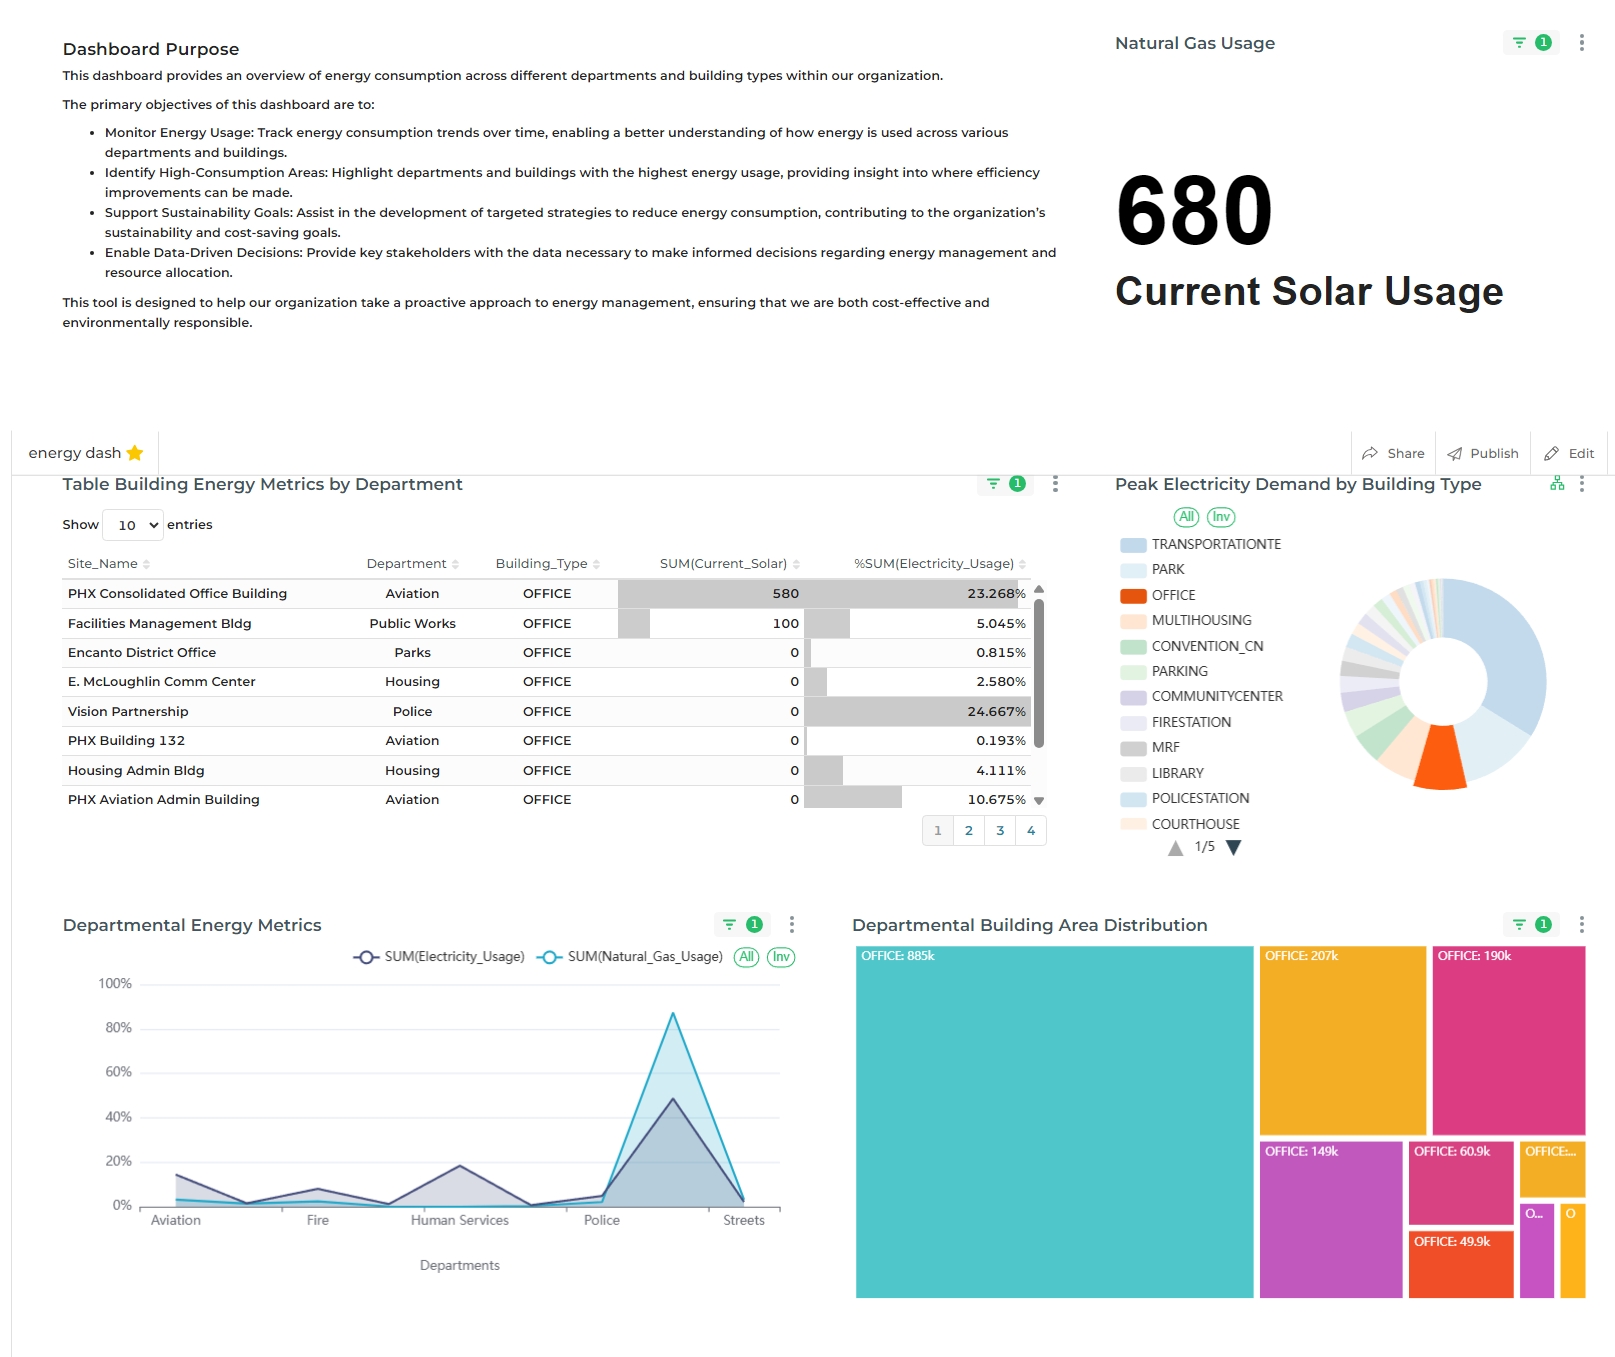
Further, let's suppose you want to provide more filtering based on the department type Aviation of the building_type from the table itself, So. simply click on the Avation department type from the table and you will see the result that both of the cross-filters are implement and a new result is showcased on each chart.
You can check which cross-filters are active in the dashboard filter bar.
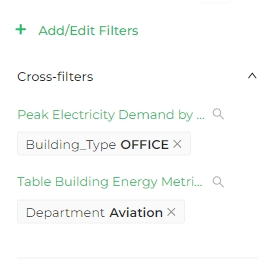
Each chart can only emit one cross-filter. If you wish to apply a filter for multiple values, use the dashboard filter bar.
Disabling Cross-Filters
In some situations, you may want to prevent dashboard consumers from using cross-filtering.
To disable cross-filtering, click on the Gear icon in the dashboard filter bar, and uncheck the Enable cross-filtering box.
Drilling into Chart Data
For users with the Viewer Workspace Role and above, accessing detailed data on a chart is made easy with the Drill to Detail feature. If you don’t see this feature, you may need to contact your Workspace Admin. Note: Embedded viewers currently don’t have access to this functionality.
The Drill to Detail feature allows you to explore the underlying data or specific metrics behind a chart in your dashboard, providing a more in-depth look at the information presented.
There are two primary ways provided to use the Drill to Detail feature:
- Using the Drop-Down Menu
- Drilling into Specific Values on a Chart
Additional Tips
Drill to Detailwill show data that is filtered based on the dashboard’s active filters, reflecting only the relevant data.- You can view up to 50 rows per page in the table.
- When applicable, the table will show formatted data by default, but you can revert to the original values by adjusting the settings via the gear icon.