Format Column Types
Table grids are a powerful way to display data in a tabular format in your DronaHQ applications. You can fetch data from sheets, SQL, and NoSQL databases using various connectors. This document explains how to enhance your data presentation in Table Grid Controls and Detail View Controls using the Format Data feature.
Using Format Data for Detail View Control
When using a Detail View Control, you can format your data using the Format Data feature. This feature allows you to format data based on the column type, making it easy to present data in a user-friendly manner.
Formatting Data for Detail View
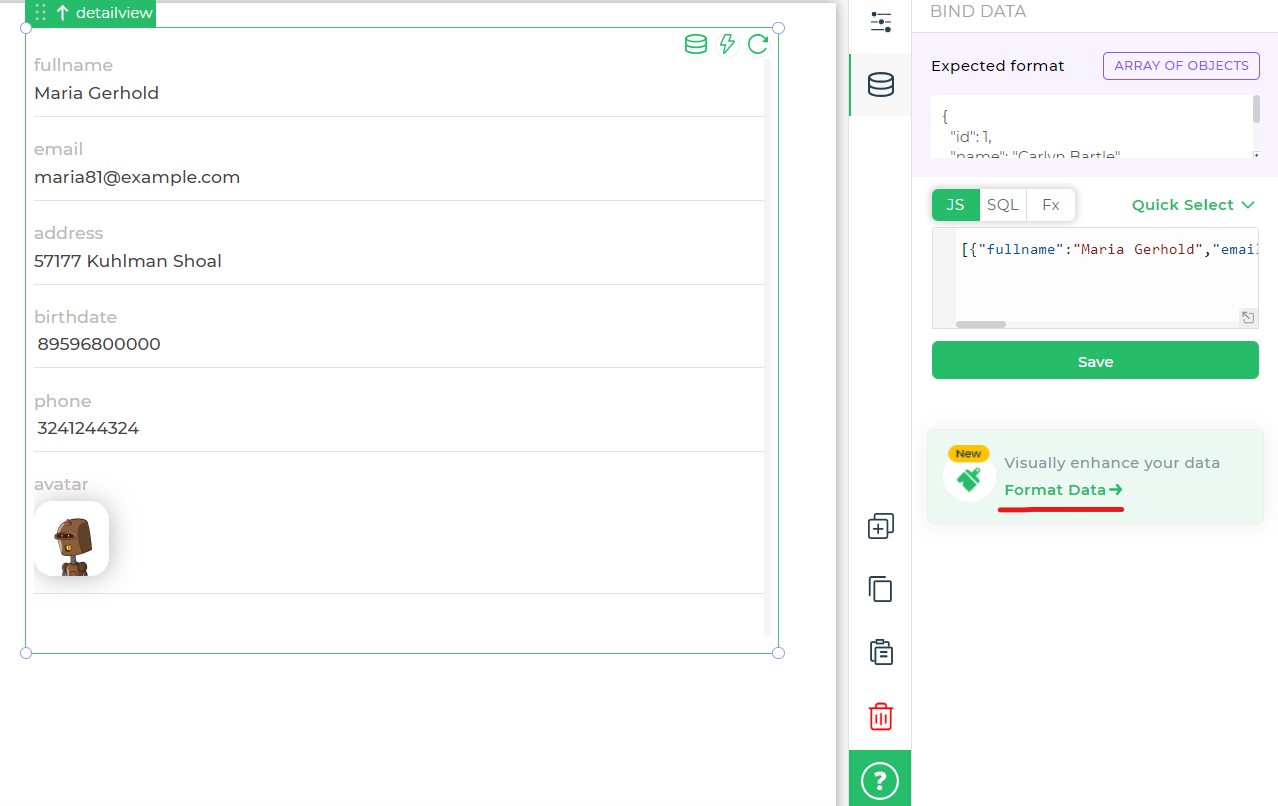
To use the Format Data feature, first bind the data source to your Detail View Control.
Select the columns you want to display and configure any necessary filters.
Click on
Bind Data, then selectFormat Datato access the Column Format settings.
- In the Column Format settings, add the column names you want to format.
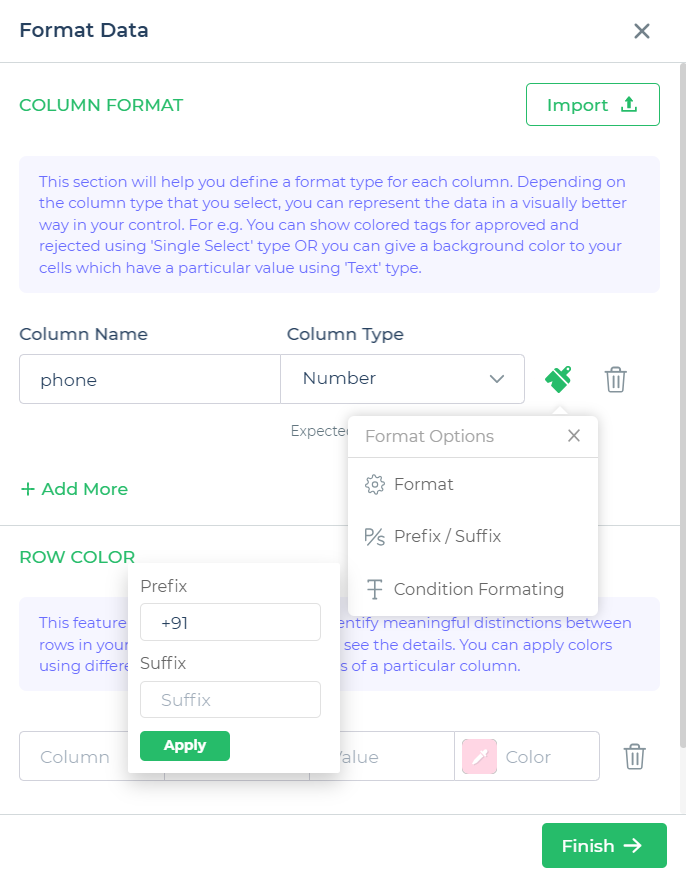
For each column, select the appropriate column type and apply the desired formatting. Click
Applyto save your changes.Once you've added formatting to your selected columns, click
Finish.When you run your form, you'll see the formatting applied to the selected columns in the Detail View Control.
Using Format Data with Table Grid Control
The Format Data feature can also be used in Table Grid Controls to format data fetched from various data sources. Here's how you can use Format Data with a Table Grid Control:
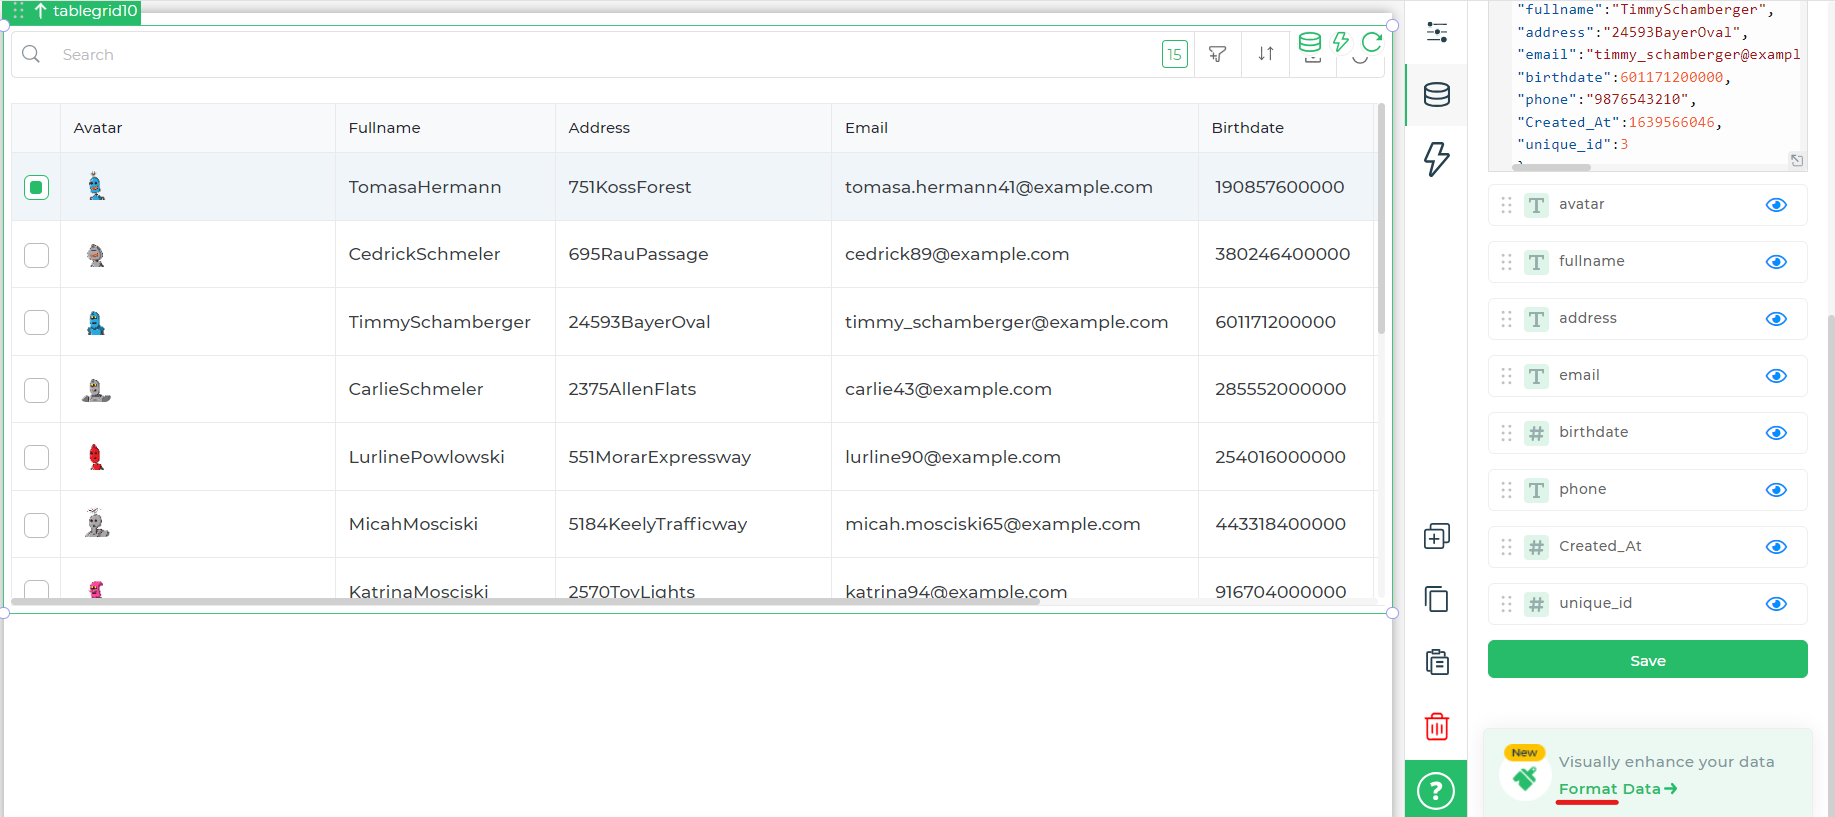
Configure your Table Grid Control and select the data source, e.g., a DB connector.
Under the
Bind Data, you'll find theFormat Databutton. Click on it to access Column and Row Formatting options.
Column Format
In Column Format, add the column names that represent the keys from your data sources.
Select the Column Type based on the data type in your columns and apply the desired formatting. Click
Applyto save your changes.You can apply various formatting options, such as adding icons, background colors, text colors, and more based on the column type.
Conditional formatting can be applied based on the value of another column, allowing for dynamic formatting.
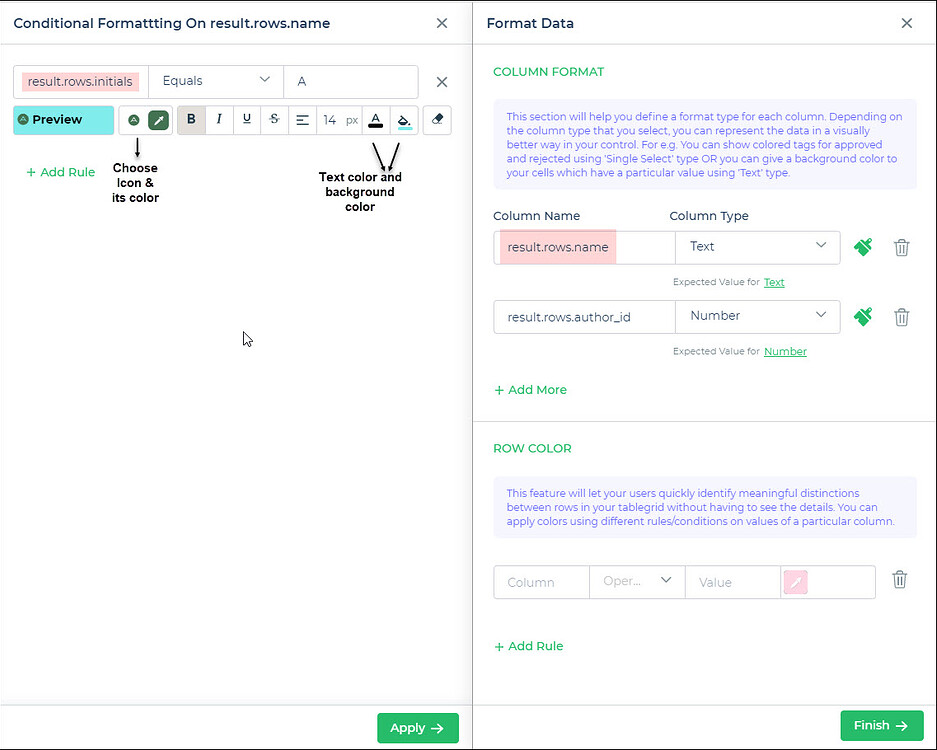
- Once you've added formatting to your selected columns, click
Finish.
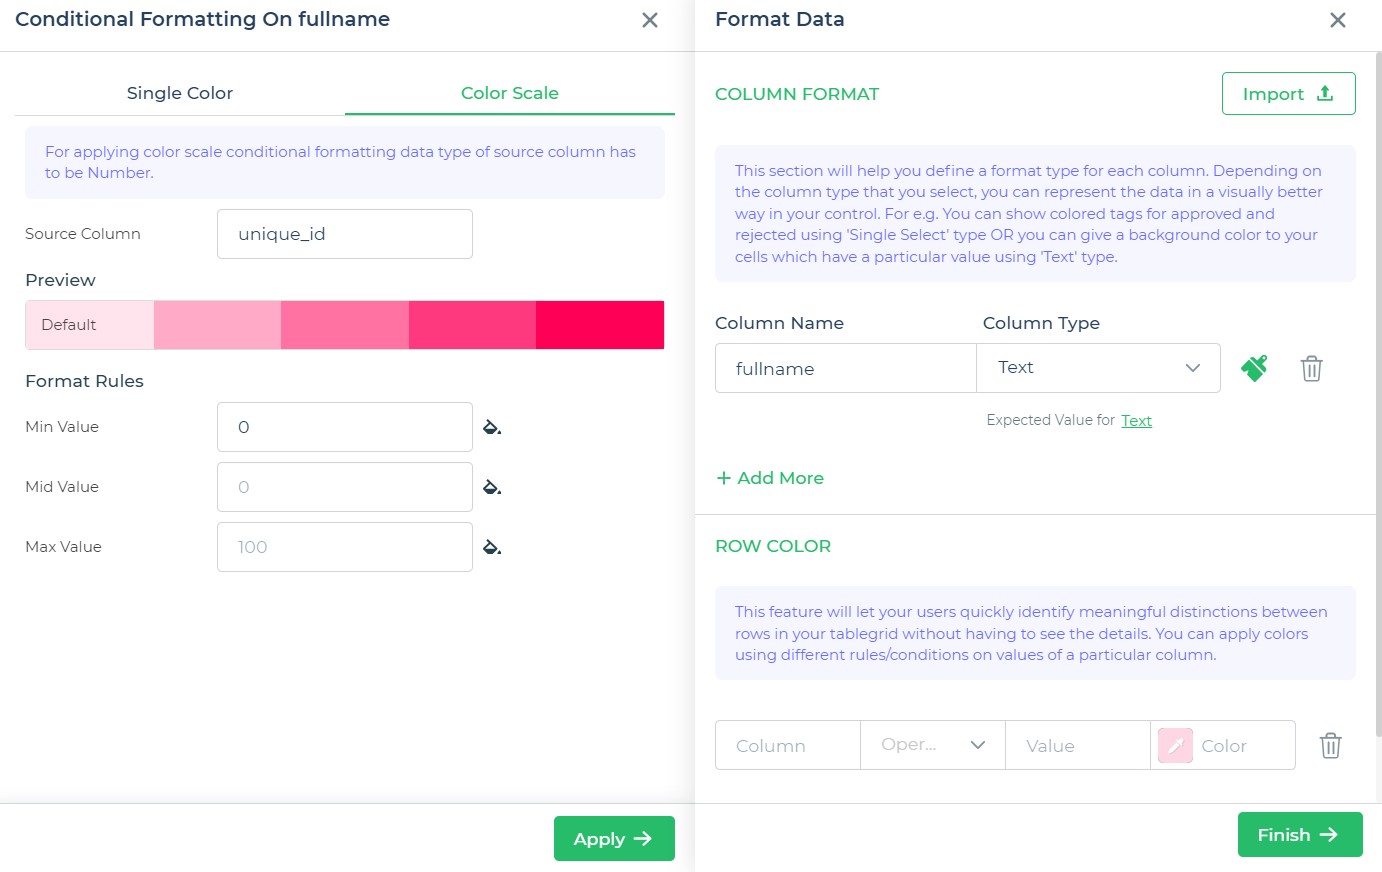
Certainly, here is the information about the Color Scale conditional formatting for Table Grid Controls presented in the requested format:
Color Scale Conditional Formatting
Source Column: In order to apply Color Scale conditional formatting, the data type of the source column must be a Number.
Unique ID: This is the source column you want to apply the Color Scale formatting to.
Preview: View the color gradients before saving.
Format Rules:
- Min Value: 0
- Mid Value: 0
- Max Value: 100
The Color Scale conditional formatting option allows you to visually represent numeric data variations using a gradient of colors. In this example, the "unique_id" column is used, and the color scale is configured to span from 0 to 100. The color assigned to each value within this range gradually changes, creating a visual representation of data distribution. This can be helpful for identifying data trends and patterns in your Table Grid Control.
Row Color
You can also apply conditional formatting to rows in a Table Grid Control. Specify conditions based on operators for different data types and change row colors based on the row values.
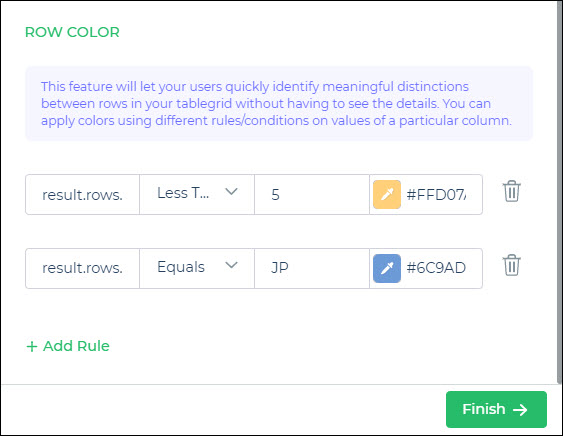
When you run the form, the formatting for both columns and rows will be applied as per the conditions specified.
Importing Formatting
To save time and effort, you can import formatting that you've applied in other Detail View or Table Grid Controls within your catalog. Here's how to do it:
- Click
Importand select the control from which you want to import the format.
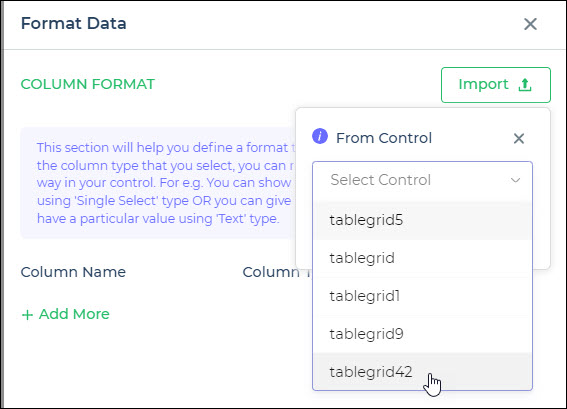
- All the relevant columns and formatting will be automatically filled based on the imported control.
By importing formatting, you can streamline the formatting process for large datasets.
If there is a column mismatch, you'll need to apply the formats manually.
Pushing Limits on Data Formatting
For a comprehensive description of the formatting options using the Format Data feature, refer to this article.
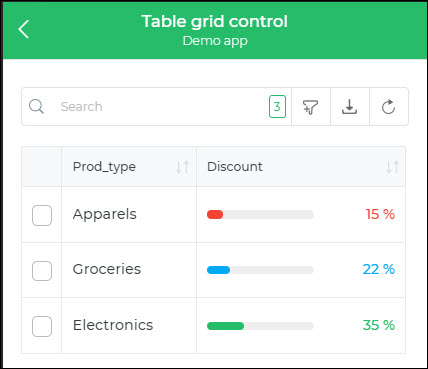
Enhance your data presentation by adding a progress bar to percentage type data.
Select the column containing percentage data.
Go to
Format Optionsand specify the limit for formatting.
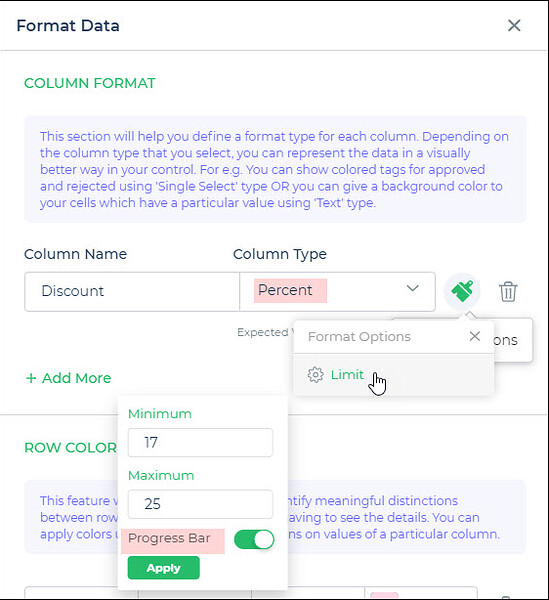
Set the minimum and maximum limit values.
Toggle the switch to display the progress bar.
By default, the progress bar's color indicates values below the minimum limit in red, within the range in blue, and above the maximum limit in green.